Forecasting Legends: Building Classification Models to Predict MLB Hall of Famers (Part 3)
Forecasting Legends: Building Classification Models to Predict MLB Hall of Famers (Part 3)
In Part 3 of this 7-part series, I examine the Hall of Fame prospects of MLB players (hitters only) after their first ten seasons.

Introduction
Welcome back to my series, "Forecasting Legends: Building Classification Models to Predict MLB Hall of Famers." In this third installment, I take my analysis to new heights by delving into the first ten seasons of a player's career. Through the utilization of cutting-edge classification models, I strive to uncover groundbreaking insights that will enhance the predictive power, unraveling the mystique surrounding the path to the esteemed realm of the Hall of Fame.
Whether you're a devoted follower of this series or seeking a recap of my previous articles, I invite you to immerse yourself in the captivating world of baseball greatness by exploring the links below. Each article holds the key to unlocking the secrets behind my methodology, enabling a deeper understanding of my quest to forecast the legends of the game.
· First 10 Years
Model 3- First 10 Years
Results
Group 1 included 5,526 records while Group 2 consisted of 970 records. After partitioning Group 1, a new dataset of 2,915 records was created (152 of which were placed in the training dataset while 2,763 were placed in the validation set). This data was fed through a Discriminant Analysis classification model as it proved to be the most accurate model of all the ones that were tested. The training set produced an accuracy of 92.11% (140/152) while the validation set produced an accuracy of 93.85% (2,593/2,763). The area under the curve of the validation set is 0.97402.


Group 1
When predicting whether a player would make it into the Hall of Fame, this model does a better job of predicting those that did not end up in the Hall of Fame (based on the validation set). Of the 2,687 players in Group 1 that are not in the Hall of Fame, the model misclassified 165 of them (6.14% error rate).

An example of one of these misclassifications is Lenny Dykstra. Over the first ten years of his career, Dykstra produced a WAR of 39.6 (T-117th among players in Group 1). During this time, he posted a slash line of .287/.376/.422 to go along with 76 HRs and 373 RBIs. He also appeared in 2 All-Star Games and was awarded a Silver Slugger. At the time, this model suggested that he had a 98.21% chance of getting into the Hall of Fame. Over the last two seasons of his career, he accumulated 2.8 WAR while posting a slash line of .263/.365/.376 and adding 5 HRs and 31 RBIs. Unfortunately, Dykstra had to call it a career after 12 seasons as he struggled to stay healthy down the stretch. At the conclusion of his 12-year career, Dykstra had a 49.36% chance of getting into the Hall of Fame (a 49.74% decrease from when his tenth season ended). When Dykstra first became eligible for the Hall of Fame in 2002, he only captured 0.2% of the vote leading to his removal from the ballot the following year.

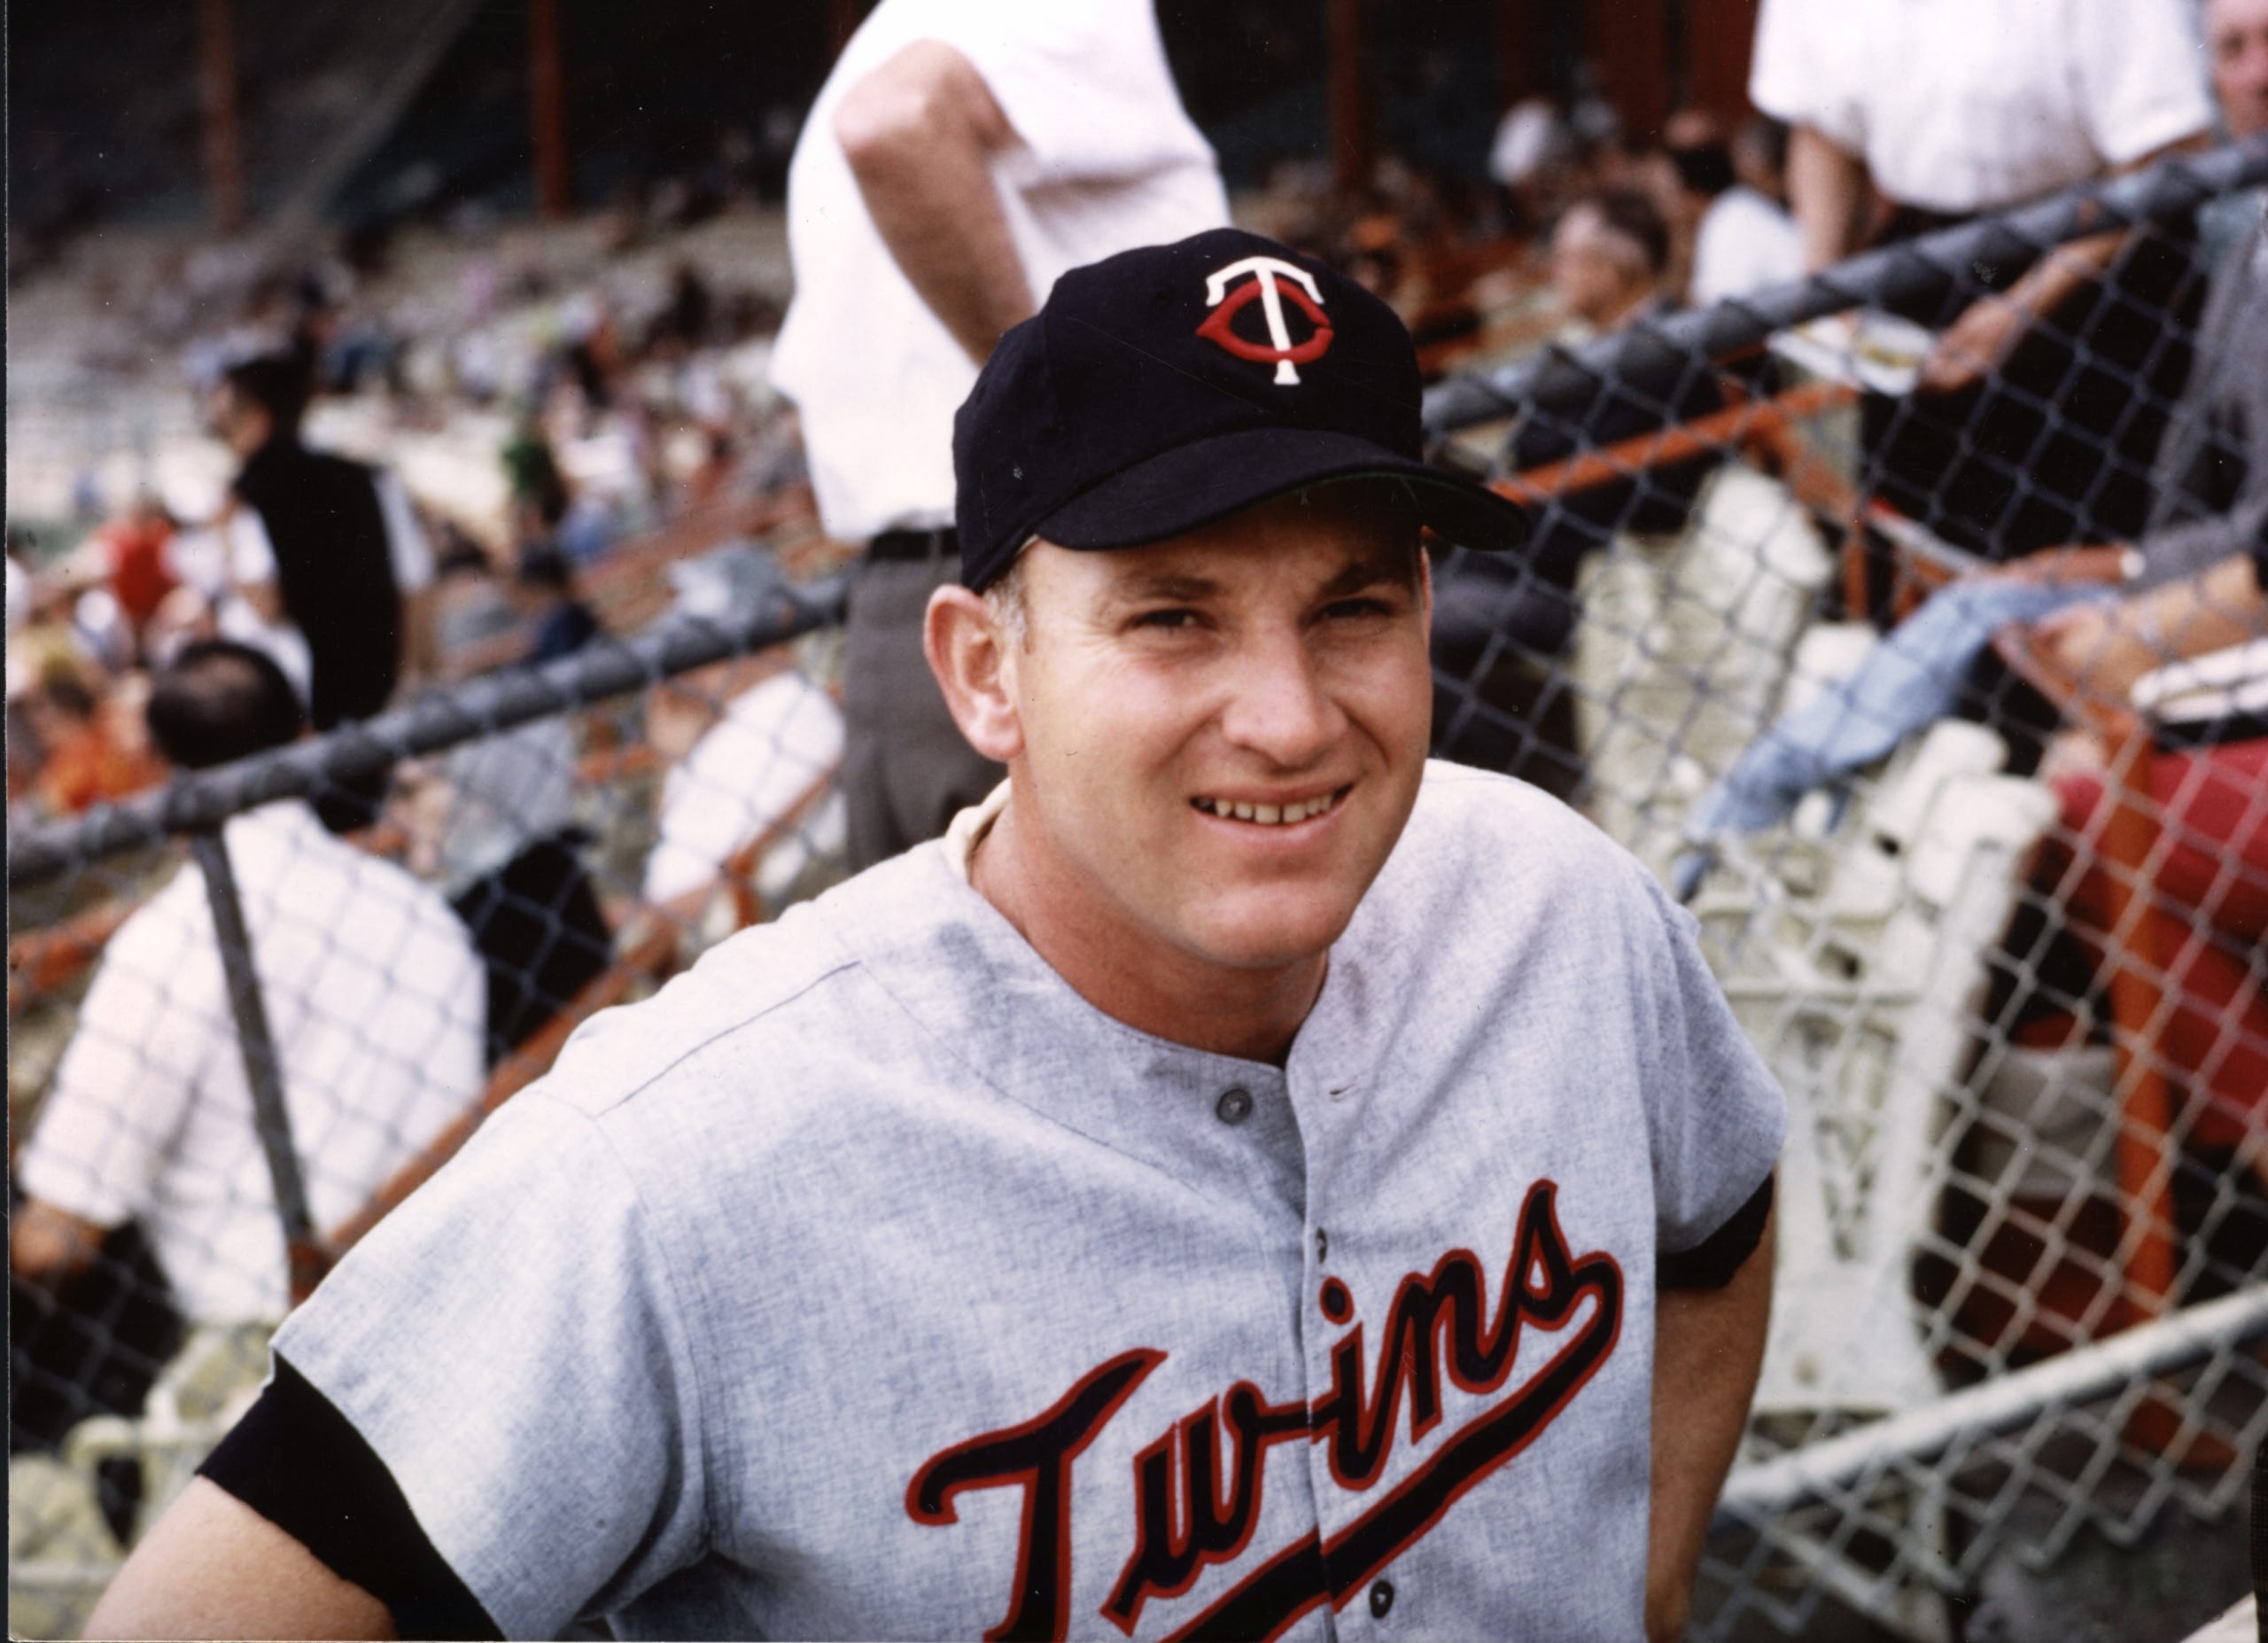
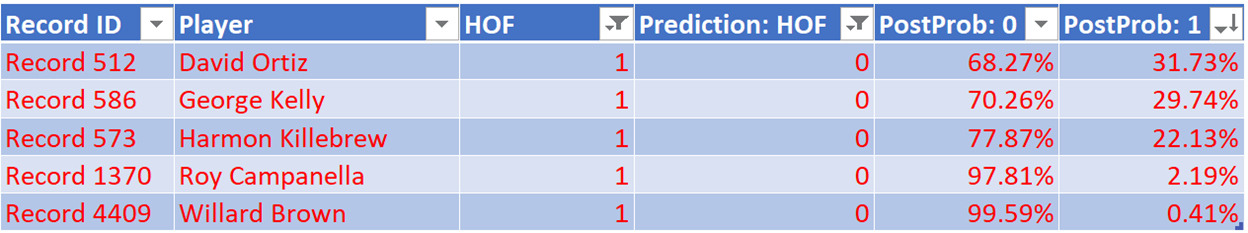
On the flip side, of the 76 players in Group 1 that are in the Hall of Fame, five were misclassified (6.58%). One example is Harmon Killebrew. In his first ten seasons, he produced a WAR of 19.4 (T-569th among players in Group 1) while posting a slash line of .258/.363/.536. He added 223 HRs and 559 RBIs. At the time, this model suggested that he had a 22.13% chance of getting into the Hall of Fame. In his final 12 seasons, he accumulated 40.9 WAR with a slash line of .255/.382/.494 while adding 350 HRs and 1,025 RBIs. He was also honored at 8 All-Star Games and took home an MVP. Killebrew was unique in that he started his career at the young age of 18 hence why it took him a little bit longer to adjust to the big leagues. After 22 seasons, he had a 98.43% chance of getting into the Hall of Fame (a 344.69% increase from when his tenth season ended). Killebrew was inducted into the Hall of Fame in 1984 (his fourth year on the ballot) when he received 83.1% of the vote.
Group 2
This model predicts that 133 players (13.71%) will make it into the Hall of Fame based on their first ten seasons. An example of someone who is no longer active is David Wright. In his first ten seasons, he accumulated 46.5 WAR (14th among players in Group 2). To go along with that, he posted a slash line of .301/.382/.506 with 222 HRs and 876 RBIs. He was honored at 7 All-Star Games and was awarded 2 Silver Sluggers. This model suggested that he had a 99.34% chance of making it to the Hall of Fame at the time. In his final four seasons, he accumulated 2.6 WAR to go along with a slash line of .265/.339/.395. Unfortunately, Wright would suffer a career-ending spinal injury leading to an earlier-than-expected retirement. Currently, he has a 90.50% chance of getting into the Hall of Fame (a 8.89% decrease from the time his tenth season ended). Wright will first be eligible for Hall of Fame consideration in 2024.

An example of a player who is active is Christian Yelich (currently of the Milwaukee Brewers). He completed his tenth season in 2022. He accumulated 36.2 WAR (T-43rd among players in Group 2) to go along with a slash line of .287/.376/.466 in this time. He also added 174 HRs and 630 RBIs. In addition, he had the honor of being recognized at 4 All-Star Games and was awarded MVP. This model suggested that Yelich had a 95.45% chance of getting into the Hall of Fame based on his first ten seasons of work. If his career were to end today, he would have a 52.18% chance of getting in.

This model also predicts that 837 players (86.29%) will not make it into the Hall of Fame. One of those players who is no longer active is Prince Fielder. Through ten seasons, Fielder accumulated 23.4 WAR (127th among players in Group 2) with a slash line of .285/.388/.522. He added 288 HRs and 886 RBIs. At that point, this model gave Fielder a 33.01% chance of making it into the Hall of Fame. In his final two seasons, he accumulated 0.5 WAR while posting a slash line of .273/.348/.419 with 31 HRs and 142 RBIs. Over the course of his 12-year career, Fielder was honored at 6 All-Star Games and was rewarded with 3 Silver Sluggers. However, Fielder’s career was cut short due to not being medically cleared to return to play after multiple neck surgeries. Currently, Fielder has a 26.47% chance of getting into the Hall of Fame (a 19.80% decrease from when his tenth season ended). Fielder first became eligible for the Hall of Fame in 2022 but failed to receive the pre-requisite number of votes to stay on the ballot the following year.

What about active players? Nick Castellanos (currently of the Philadelphia Phillies) completed his tenth season in 2022. In that time, he accumulated 12.5 WAR (267th among players in Group 2) while posting a .276/.326/.475 slash line with 181 HRs and 656 RBIs. This model suggested that Castellanos had a 6.12% chance of getting into the Hall of Fame based on his first ten seasons of work. He clearly has some work to do if he wants to be on the Hall of Fame radar because if his career were to end today, he would have a 2.30% chance of getting in.

HOF Probabilities from Year 5 to Year 10
As we witnessed in previous installments of this series, certain players embarked on a swift trajectory toward the Hall of Fame, while others encountered significant challenges in solidifying their presence in the major leagues. To gain a deeper understanding of the players who bolstered their chances of entering the Hall of Fame and those who faced hurdles along the way, I will analyze and compare their probabilities after five seasons to their probabilities after ten seasons.
Risers
Over the course of his first five seasons, Brooks Robinson struggled to establish himself as an MLB player. In this time, he accumulated 1.4 WAR while posting a slash line of .249/.296/.336 with 10 HRs and 72 RBIs. His odds of getting into the Hall of Fame at this point were slim (9.22%). Late into his fifth season, he began to show glimpses of what he could become. He would carry over that momentum into his sixth season and he never looked back. Over the next five years of his career, Robinson accumulated 24.6 WAR while posting a slash line of .291/.336/.442 with 83 HRs and 420 RBIs. This period was highlighted by five straight All-Star Game appearances, five straight Gold Gloves, and an MVP season. At the conclusion of his tenth season, Robinson would have a 68.69% chance of getting into the Hall of Fame (a 644.94% increase from when his fifth season ended). When Robinson retired in 1977 after his 23rd season, he had a 99.99% chance of getting into the Hall of Fame and did so in 1983 (his first year on the ballot) when he received 92.0% of the vote.

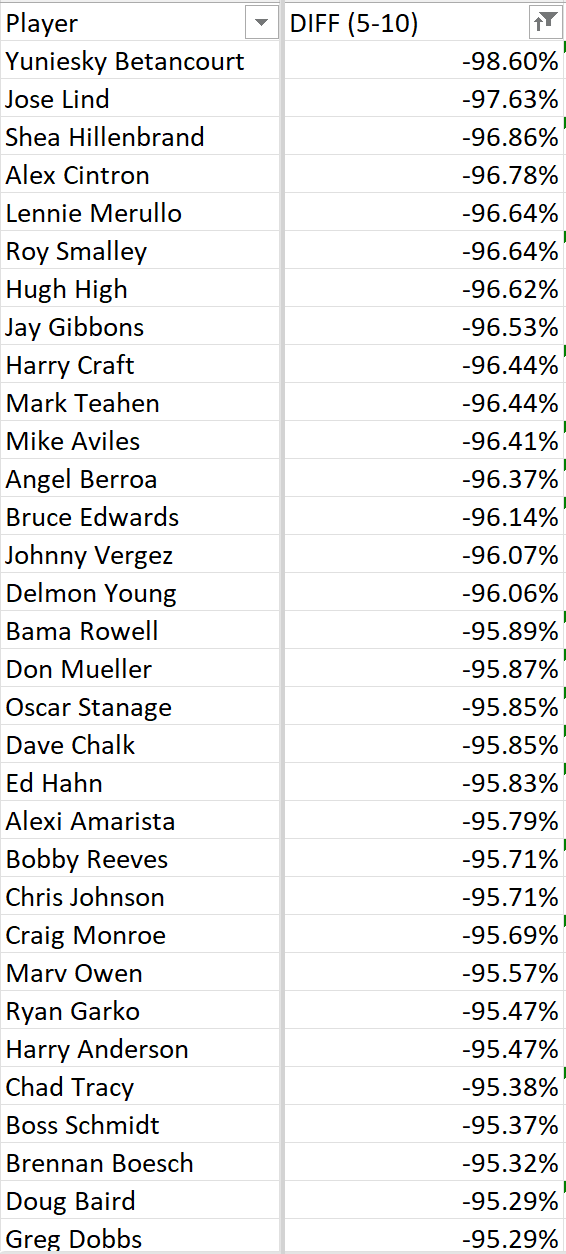
Fallers
Through his first five seasons, Stephen Vogt accumulated 7.0 WAR while posting a slash line of .255/.315/.415 with 45 HRs and 178 RBIs. At this point, Vogt had a 45.74% chance of getting into the Hall of Fame. In his next five seasons, he accumulated 0.1 WAR while posting a slash line of .215/.281/.393 with 37 HRs and 135 RBIs. His odds of making it into the Hall of Fame were now at 2.28% (a 95.01% decrease from when his fifth season ended). At this point, Vogt decided to call it a career after ten seasons leaving him with a 0.91% chance of getting into the Hall of Fame. He will first be eligible for the Hall of Fame in 2028.