
Forecasting Legends: Building Classification Models to Predict MLB Hall of Famers (Part 1)
Forecasting Legends: Building Classification Models to Predict MLB Hall of Famers (Part 1)
In Part 1 of this 7-part series, I examine the Hall of Fame prospects of MLB players (hitters only) after their first five seasons.


Introduction
Ken Griffey Jr., Mike Piazza, and Rickey Henderson. What do all these guys have in common? They are forever enshrined among the greatest hitters to ever play the game at the National Baseball Hall of Fame in Cooperstown, New York. However, each of the 342 elected members (as of June 2023) has taken a different path to secure a spot amongst the best of the best. Whether it was David Ortiz who did not come onto the scene until his seventh season with his second team or Jeff Bagwell who won the Rookie of the Year Award in his first season and never looked back. While a player may have an illustrious career, his fate rests in the hands of the Baseball Writers’ Association of America (or the Eras Committee). Each player’s career numbers tell a different story. But will that story end with a trip to the Hall of Fame?
Purpose
To explore the probability of a player getting into the Hall of Fame at certain points throughout their career and identify those MLB players (active or inactive) that have high probabilities of getting into the Hall of Fame at the current stage of their career strictly based off the player’s statistical profile at that point in their career.
Data
All the data that was used in this project comes from Baseball Reference’s Stathead resource. The data was pulled for each of the time periods being observed (Hall of Famers, Non-Hall of Famers, and inactive players that are still eligible to get into the Hall of Fame). For the active players, they were evaluated based on how many years they have played up to this point in their career (ex. Ronald Acuna Jr. has completed five full MLB seasons). Therefore, Acuna can primarily be evaluated based on his first five years in the league). However, for each of the active players, they will also have a probability associated with them in the scenario their career ended today. Those numbers should be taken with a grain of salt. A variety of stats were pulled for each player. Basic counting stats such as Runs Scored (R), Hits (H), and Runs Batted In (RBI). Rate stats such as Batting Average (BA), On Base Percentage (OBP), and Slugging Percentage (SLG). Advanced stats such as Wins Above Replacement (WAR), Wins Above Average (WAA), and Runs Batting (Rbat). Keep in mind, there were distinct filters put in place to retrieve the most accurate data. Only players from the modern era were looked at (1900-Present). Players whose primary position is pitcher were excluded (sorry Madison Bumgarner). Finally, the player must have accumulated at least fifty plate appearances during the time period being observed to qualify for further analysis (at least 1,000 plate appearances when evaluating a player’s entire career — Group 1 only ). The pulled data was broken down into two groups based on the time period being observed: those players whose careers have ended and are either in the Hall of Fame or failed to get in through the BBWAA ballot (Group 1) and those players whose careers have ended but can still make it into the Hall of Fame or active players (Group 2). The former was used to create a classification model to predict whether the players from the latter dataset have a good shot of getting in. Aside from the fields that are captured on Baseball Reference, I added a few additional fields. World Series Wins and Awards were extracted from the Lahman Baseball Database. I added another column that served as my output variable (HOF?) and coded the players with a zero or one. If a record was coded as a one, it means they are in the Hall of Fame. If a record was coded as a zero, the player is not in the Hall of Fame. Note: This column was not included among Group 2 as those outcomes have yet to be determined.


Methodology
To perform the analysis of the data pulled from Baseball Reference, I implemented the use of classification models that would serve to predict whether an MLB player would be a Hall of Famer or not. However, before feeding the data through this type of model, I needed to ensure the data was ready to go. For each time period that was observed, the data needed to undergo specific changes. From a general sense, the following things were done to carefully analyze the data:
· Partition w/ Oversampling- The datasets were skewed heavily towards players who are not in the Hall of Fame. Therefore, it was determined that half of the success class (Hall of Famer) would exist in the training set while the other half would exist in the validation set. The other class (non-Hall of Famers) was split up so that there were a proportionate number of cases (equal to the success class) in the training set with the remaining cases being pushed to the validation set.

· Feature Selection- In total, there were 28 different statistics that I observed. It was essential to reduce this number so that only the most important statistics in determining a Hall of Fame player were used. First, I eliminated any of the statistics that resembled another stat too closely (ex. OPS & OPS+). Then, I fed the remaining statistics through a feature selection process. The output variable is the “HOF?” field. I looked for the seven most important fields based on their F-Statistic values (the lower the p-value, the more significant the variable is in determining a Hall of Famer). In the end, the seven most important fields came out to be WAR, oWAR, Rbat, WAA, All-Star Appearances, Runs, and Awards. These fields were used for the classification model for each time period that was observed.

· Finding the Best Model- To determine which model is most appropriate for this exercise, I tested the seven most important fields on a variety of classification models. They included a Logistic Regression, Decision Tree, Nearest Neighbors, Linear Discriminant, Bagging, Boosting, and Random Trees. In the end, whichever set of fields produced the most accurate model was used for further analysis. Note: Not all the time periods observed ended up with the same model applied to the data.

· Time Periods Observed- To better understand the chances of a player getting into the Hall of Fame as their career went on, I evaluated their statistical profiles at various stopping points throughout their career. The time periods being observed are after a player’s:
o First 5 Years
As I move along in this series of articles, I will be sure to reference what the player’s chances of making it into the Hall of Fame were at the conclusion of his career (or what the player’s chances are currently if they are active). This data will be explained in more detail when I discuss part six of this series.
Feel free to click on any of the time periods above to view that specific article (if you cannot click on it, that means it is not available).
Other Things to Keep an Eye Out For:
There will be several screenshots throughout this project. Here is a breakdown of some of the things they will be telling you:
Performance Metrics Summary for Classification Model

· Accuracy (#correct): This row represents the total number of correct predictions made by the classification model, indicating how many instances were classified correctly.
· Accuracy (%correct): This row shows the percentage of correct predictions made by the model, providing an overall measure of its accuracy.
· Specificity: This row indicates the proportion of true negatives (Predicted Non-Hall of Famer and Actual Non-Hall of Famer) correctly identified by the model, representing its ability to correctly classify negative instances.
· Sensitivity (Recall): This row reflects the proportion of true positives (Predicted Hall of Famer and Actual Hall of Famer) correctly identified by the model, indicating its ability to correctly classify positive instances.
· Precision: This row represents the proportion of true positives (Predicted Hall of Famer and Actual Hall of Famer) among all instances predicted as positive, providing an insight into the model's precision or positive predictive value.
· F1 score: This row presents the harmonic mean of precision and recall, providing a single metric that combines both precision and recall into a single measure of performance.
· Success Class: This row indicates the class considered as the success class in the classification model (Hall of Famer).
· Success Probability: This row represents the probability threshold used for classifying instances as belonging to the success class (Hall of Famer).
Error Report

· Class: This column represents the class label or category for which the errors are being reported. In this case, there are two classes, denoted as 0 (Non-Hall of Famer) and 1 (Hall of Famer).
· Cases: This column indicates the total number of cases or instances belonging to each class.
· Errors: This column shows the number of misclassified cases or instances for each class.
· % Error: This column represents the percentage of misclassification errors for each class, calculated by dividing the number of errors by the total number of cases and multiplying by 100. It provides a measure of the error rate or the proportion of misclassified instances relative to the total number of instances in each class.
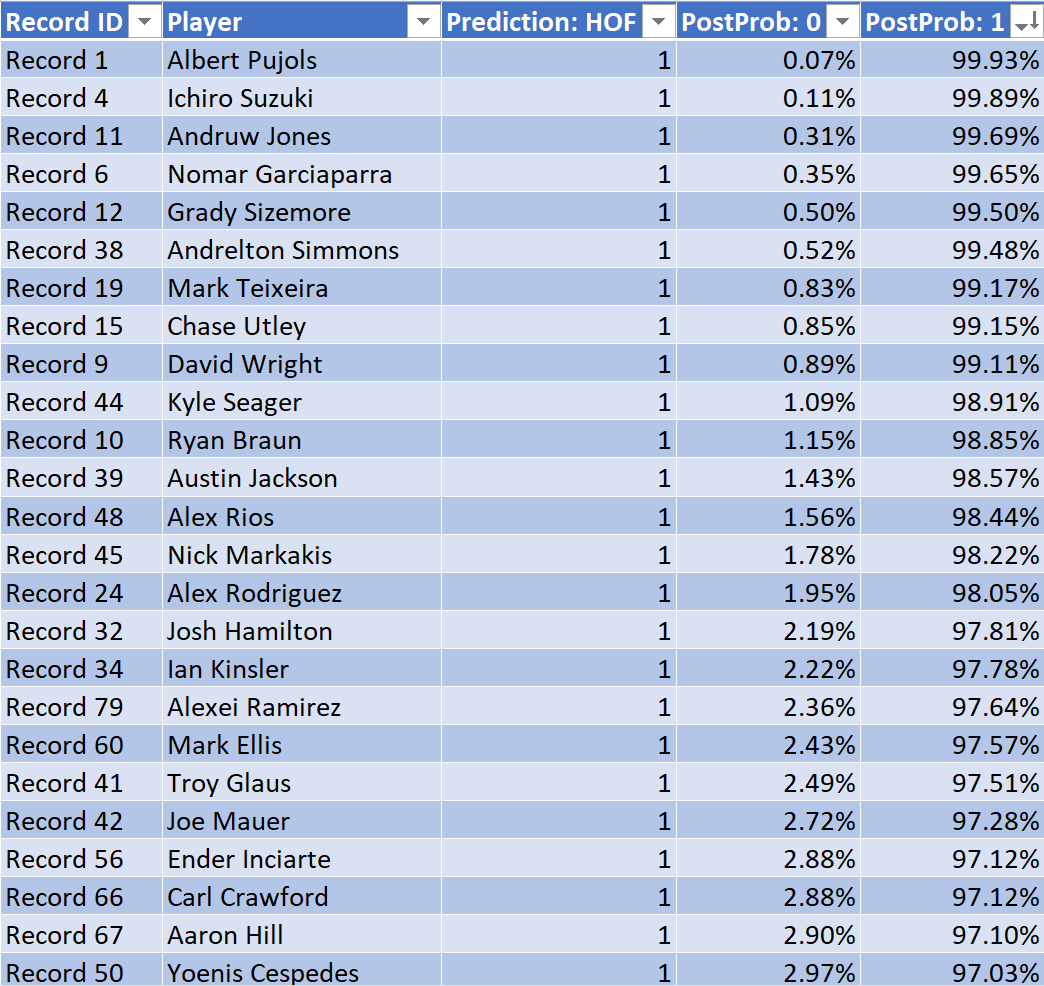
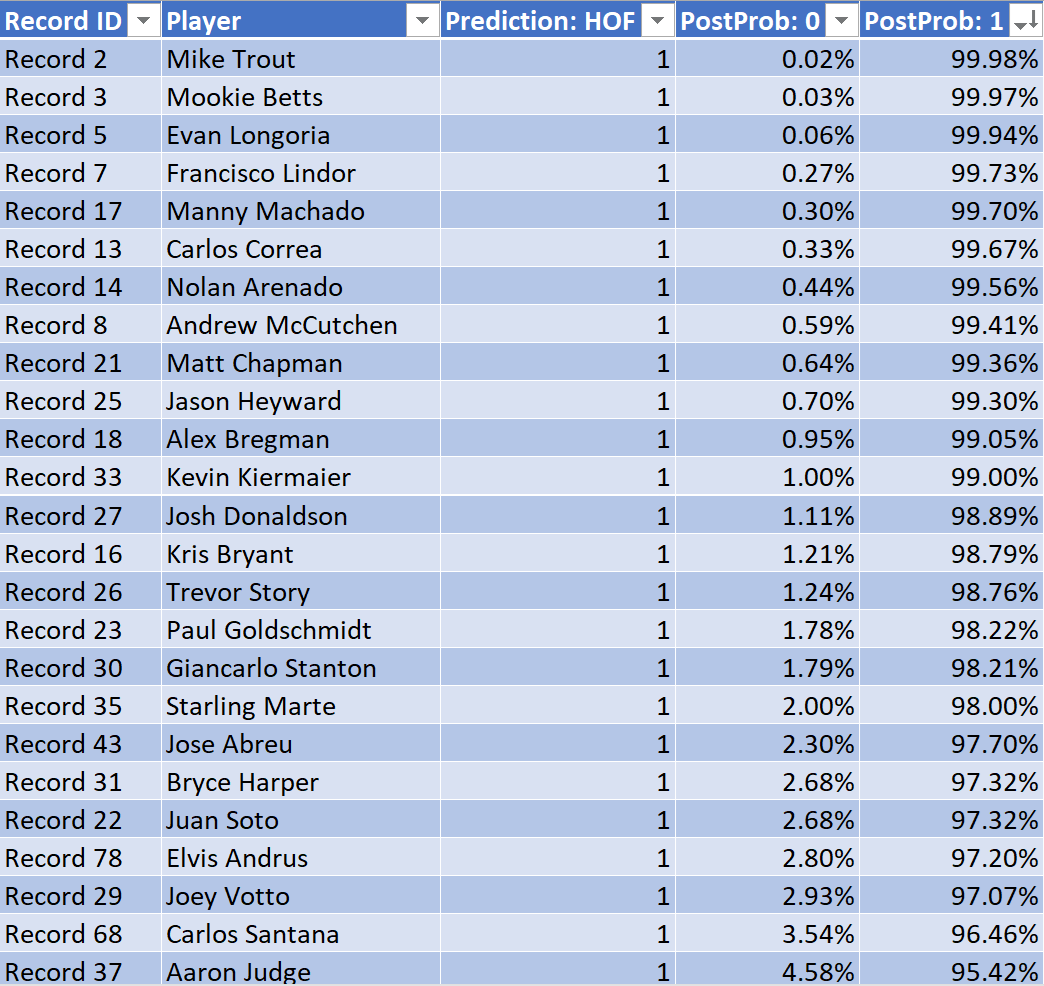
Prediction Table

· Player: Represents the name of the player.
· Record ID: Indicates the unique identifier or reference for each player's record.
· Prediction: HOF: Shows the prediction for Hall of Fame (HOF) induction. A value of 0 indicates that the player is not predicted to make it to the HOF. A value of 1 indicates that the player is predicted to make it to the HOF.
· PostProb: 0: Represents the posterior probability of the player not being inducted into the HOF (>=50.00% is equal to a Non-Hall of Famer)
· PostProb: 1: Represents the posterior probability of the player being inducted into the HOF (> 50.00% is equal to a Hall of Famer)
HOF Rules & Eligibility
· A player must have played at least ten seasons in the MLB to be put on the ballot
· A player is eligible for the Hall of Fame five years after their career ends
· To remain on the Hall of Fame ballot, you must capture at least 5% of the vote
· To get elected to the Hall of Fame, you must capture at least 75% of the vote
· A player can stay on the ballot for ten years (before 2014, a player could stay on the ballot for fifteen years). If the player does not get elected within that time frame, there may be other opportunities to get in down the line (e.g., Eras Committee)
Model 1- First 5 Years
Results
Group 1 included 5,488 records while Group 2 consisted of 1,400 records. After partitioning Group 1, a new dataset of 2,905 records was created (142 of which were placed in the training dataset while 2,763 were placed in the validation set). This data was fed through a Discriminant Analysis classification model as it proved to be the most accurate model of all the ones that were tested. The training set produced an accuracy of 88.03% (125/142) while the validation set produced an accuracy of 89.21% (2,465/2,763). The area under the curve for the validation set was 0.95555.


Group 1
When predicting which players would be in the Hall of Fame, this model does a better job of predicting those that did not end up in the Hall of Fame (based on the validation set). Of the 2,691 players in Group 1 that are not in the Hall of Fame, the model misclassified 289 of them (10.74% error rate).

An example of one of these misclassifications is Darryl Strawberry. Over the first five years of his career, Strawberry produced a WAR of 20.1 (T-84th among players in Group 1) while posting a slash line of .266/.366/.525 with 147 HRs and 447 RBIs. He also was recognized at four All-Star Games and was awarded Rookie of the Year. At the time, this model gave him a 97.38% chance of getting into the Hall of Fame. Unfortunately, his production cratered as he moved along in his career. During his final 12 seasons, Strawberry accumulated 22.1 WAR while posting a slash line of .253/.350/.491 with 188 HRs and 553 RBIs. From the point he turned 30 to the end of his career, he never made it back to an All-Star Game after making it in eight of his first nine seasons. At the conclusion of his career, Strawberry had a 54.81% chance of getting into the Hall of Fame (a 43.72% decrease from the point he finished his fifth season). Strawberry was first eligible for the Hall of Fame in 2005 but failed to stay on the ballot after that as he only captured 1.2% of the vote.

On the flip side, of the 72 players in Group 1 that are in the Hall of Fame, nine were misclassified (12.5%). One example is Nellie Fox. Over the first five years of his career, Fox produced a WAR of 4.2 (1,094th among players in Group 1) while posting a slash line of .277/.344/.356 with 4 HRs and 106 RBIs. At the time, this model gave him a 20.43% chance of getting into the Hall of Fame. His career began to take off in year five as he made it to 11 straight All-Star games. In his final 14 seasons, Fox accumulated 44.3 WAR with a slash line of .290/.348/.364 to go along with 31 HRs and 684 RBIs. He was also awarded MVP in 1959. At the conclusion of his career, Fox had a 99.83% chance of getting into the Hall of Fame (a 388.62% increase from the point he finished his fifth season). Fox remained on the Hall of Fame ballot for 10 years but the highest percentage of the vote he captured was 44.8%. However, Fox would get voted into the Hall of Fame via the Veterans Committee in 1997.

Group 2
This model predicts that 256 players (18.29%) will make it into the Hall of Fame based on their first five seasons. One example of someone who is no longer active is Yoenis Cespedes. In his first five seasons, he accumulated 18.9 WAR (49th among players in Group 2). To go along with that, he posted a slash line of .272/.325/.494 with 137 HRs and 453 RBIs. This model suggested that he had a 97.03% chance of making it to the Hall of Fame at the time. However, from that point on in his career, he was not the same player. He would go on to play just three more seasons while accumulating 2.7 WAR and posting a slash line of .274/.336/.516 with 28 HRs and 75 RBIs. Currently, Cespedes has a 9.22% chance of getting into the Hall of Fame (a 90.50% decrease from the point he finished his fifth season). Unfortunately, he did not play the minimum number of seasons in the league to be eligible to get in.
An example of a player who is active is Kyle Tucker (currently of the Houston Astros). He completed his fifth season in 2022. He accumulated 12.9 WAR (122nd among players in Group 2) to go along with a slash line of .268/.335/.502 in this time. He also added 73 HRs and 256 RBIs. At the time, this model suggested that Tucker had a 76.97% chance of getting into the Hall of Fame based on his first five seasons of work. But, if his career were to end today, he would only have a 3.98% chance of getting in.
This model also predicts that 1,144 players (81.71%) will not make it into the Hall of Fame. One of those players who is no longer active is Yadier Molina. Through five seasons, Molina accumulated 5.1 WAR (430th among players in Group 2) with a slash line of .262/.316/.360. He added 29 HRs and 209 RBIs. At that point, this model gave Molina a 41.99% chance of making it into the Hall of Fame. He would go on to accumulate 37.2 WAR while producing a slash line of .282/.331/.410 in his final 14 seasons. He would also add nine gold gloves and four platinum gloves in that stretch. Currently, Molina has a 93.11% chance of getting into the Hall of Fame (a 121.75% increase from the time his fifth season ended). He will be eligible beginning in 2027.

What about active players? Tyler O’Neil (currently with the St. Louis Cardinals) completed his fifth season in 2022. In that time, he accumulated 9.7 WAR (T-206th among players in Group 2) while posting a .251/.320/.468 slash line with 69 HRs and 196 RBIs. At the conclusion of his fifth season, this model suggested that he had a 43.60% chance of getting into the Hall of Fame. But, if his career were to end today, he would have a 1.19% chance of getting in.

Wow, I learned a lot! Excellent approach on hall of famers stats!
wow insightful good stats analysis of hof