


Plane Points: MLB Lineup Optimizer (Update & NL East)
Tracking how Plane Points and evolving player performance have shaped optimal lineups since Opening Day...

This article begins a new series revisiting my MLB Lineup Optimizer, powered by my custom scoring system, Plane Points. As a quick review, Plane Points is a system I created to better evaluate player performance across various attributes, including on-base ability, power, and situational outcomes. A full explanation of the approach can be found here. Throughout the season, I’ve kept refining the model based on how lineups are generated and how players perform both in real life and through the lens of Plane Points. To better understand how this lineup optimizer works, revisit one of my earlier posts here.
Two Versions of the Optimizer
The optimizer operates in two distinct modes:
Matchup-Specific Optimizer – Uses the actual opposing pitcher that day, including their past performance and relevant splits.
Generic Optimizer – Builds lineups based solely on the opposing pitcher’s handedness (RHP or LHP).
If you follow me on X, you’ve likely seen my optimized lineups for every Miami Marlins game this season. While I would have loved to apply the matchup-specific model to all 30 teams, time constraints limited its scope. However, I’ve consistently generated handedness-based lineups for every team throughout the season.
How the Lineup Is Built
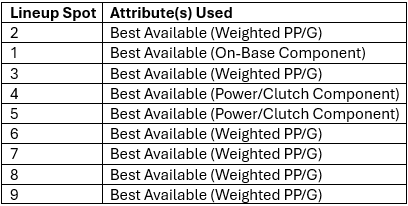
All optimized lineups are generated using Plane Points. The visual below outlines the order in which each lineup spot is filled during the optimization process. I begin by filling the No. 2 spot first, as I believe that’s where the team’s best hitter should bat. The leadoff spot (No. 1) is filled next, prioritizing the best available on-base profile not already selected. The remaining spots are filled sequentially, based on a mix of scoring profiles, positional needs, and matchup context.
New Eligibility Filter: Reducing Small-Sample Noise
One of the biggest updates I implemented earlier in the season is a new eligibility filter to reduce noise from small-sample players. For a player to be considered in any optimized lineup, they must meet at least one of the following:
20+ plate appearances this season, or
30+ plate appearances over the past three years
This filter eliminates extreme outliers and ensures the optimizer is drawing from a more statistically meaningful pool of players.
Refined Weighting and Matchup Logic
Early in the season, current-year data were limited and volatile. To compensate, I weighted prior-year stats more heavily when generating lineups.
As the 2025 season matured, particularly around mid-May, I gradually shifted that weighting to prioritize this season’s performance, which had become more reliable.
In the matchup-specific optimizer, three categories drive decisions:
Vs. Pitcher
Vs. Team
Vs. Similar Pitchers (based on pitch movement and hitting profile)
While these categories have always been part of the model, I recently introduced tiered weighting. The number of plate appearances a player has in each category now determines how much that data influences the optimizer. For example, a player with 50 PA vs. a pitcher will be weighted more heavily than one with just 5 PA. This improves the balance between sample size stability and matchup-specific relevance.
Evaluating Optimizer Performance
To measure effectiveness, I created a system that compares Plane Points earned by the optimized lineup vs. the actual lineup used in each game. This allows me to assess whether the optimizer is outperforming real-world decision-making. I’ll publish a full evaluation at the end of the season.
What’s Ahead
This series will walk through how each team’s optimal lineup has evolved since Opening Day, factoring in trades, injuries, role changes, and performance trends.
A quick note: all lineups featured in this series are generated using the generic optimizer, which builds lineups based solely on the opposing pitcher’s handedness (RHP or LHP). While my matchup-specific model accounts for individual pitchers and team-level trends, it is not the focus of this series.
Throughout, I’ll reference key metrics from my Plane Points scoring system — most notably Plane Points per Game (PP/G), including splits vs. RHP and LHP. I’ll also highlight supporting attributes that drive lineup decisions, such as on-base skills, power components, recent form, and situational performance. These factors explain why players move up, down, or into the lineup.
Color Key for Lineup Movement
🟩 Moved Up
🟥 Moved Down
🟦 New to the lineup
We begin with the National League East. The lineups below reflect the optimized lineups generated on Opening Day and as of today, using the generic model. These are not the actual lineups used in games, but rather the ones the optimizer would have recommended based on available data at each point in time.
Atlanta Braves
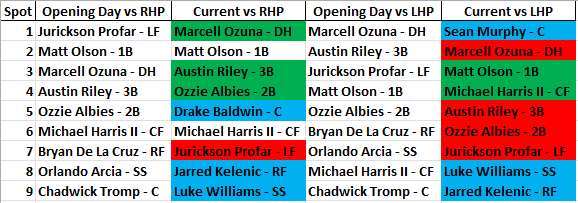
vs. RHP
Bryan De La Cruz, Orlando Arcia, and Chadwick Tromp are no longer with the organization, clearing space for new contributors.
Rookie Drake Baldwin has made a strong impact, ranking 4th on the team in PP/G and 5th in the power component.
Despite a somewhat down season, Marcell Ozuna has moved into the leadoff spot. He ranks 1st in productive plate appearances (PA) ending in more than 4 pitches and 2nd in pitches seen per PA.
vs. LHP
The same trio of De La Cruz, Arcia, and Tromp has been removed.
Sean Murphy now leads off, ranking 1st in both productive PAs ending in more than 4 pitches and pitches seen per PA.
Michael Harris II has moved into the cleanup spot. He owns a .394 SLG vs. LHP (compared to .362 vs. RHP) and ranks 1st in productive PAs with RISP and 3rd in runs generated.
New York Mets
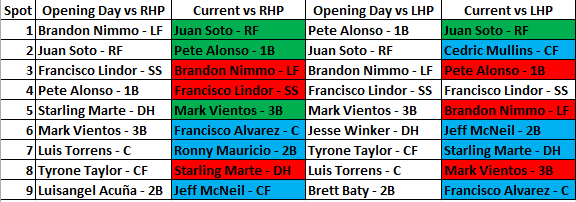
vs. RHP
Luis Torrens, Luisangel Acuña, and Tyrone Taylor have been removed.
Ronny Mauricio, back from injury, is a key addition. He’s averaging 35 PP/G over the past 14 days, the highest on the team.
With Pete Alonso now locked into the No. 2 spot, Juan Soto leads off. He ranks 1st on the team in:
Productive PAs ending in more than 4 pitches
PAs where the hitter starts and ends ahead in the count with a productive outcome
Pitches seen per PA
vs. LHP
Jesse Winker, Tyrone Taylor, Luis Torrens, and Brett Baty have been removed.
Cedric Mullins joins the lineup in the No. 2 spot. He has reverse splits this season, with an .847 OPS vs. LHP (compared to .678 vs. RHP) and is averaging 9 PP/G, 3rd most among active Mets.
Jeff McNeil now hits 6th. He also owns reverse splits, with a .926 OPS vs. LHP (.758 vs. RHP) and leads the team at 11 PP/G.
Miami Marlins
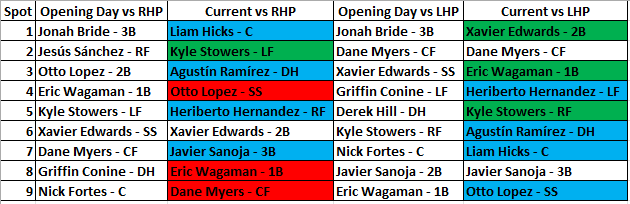
vs. RHP
Jonah Bride, Jesús Sánchez, Griffin Conine, and Nick Fortes have been removed.
The 2 and 3 spots now belong to Kyle Stowers and Agustín Ramírez, respectively. Stowers leads the team with 29 PP/G, while Ramírez is 3rd with 20 PP/G.
Liam Hicks, previously ineligible due to a limited sample size, now leads off. He ranks 1st in both productive PAs ending in more than 4 pitches and pitches seen per PA.
vs. LHP
Jonah Bride, Griffin Conine, Derek Hill, and Nick Fortes have been removed.
Eric Wagaman has risen in this lineup after initially having a small sample of PA. He’s averaging 5 PP/G, good for 4th on the team.
Heriberto Hernandez, who began the season in the minors, now bats cleanup. He ranks 1st in productive PAs with RISP and 3rd in runs generated.
Washington Nationals
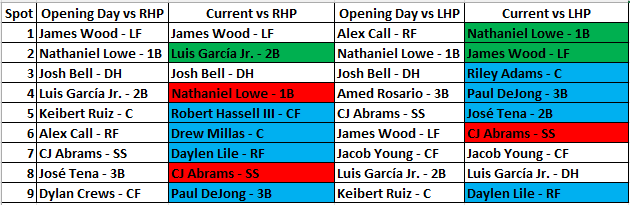
vs. RHP
Keibert Ruiz, Alex Call, José Tena, and Dylan Crews have been removed.
Luis García Jr. is red hot, averaging 22 PP/G over the past 7 days (3rd on team) and 19 PP/G on the season (2nd on team).
Robert Hassell III has moved into the 5 spot. He ranks 4th in productive PAs with RISP and 2nd in runs generated.
vs. LHP
Alex Call, Amed Rosario, Josh Bell, and Keibert Ruiz have been removed.
James Wood now occupies the No. 2 spot. After averaging 9 PP/G last year, he leads the team with 16 PP/G this season.
Riley Adams hits 3rd, thanks to a recent surge. While his overall average is -3 PP/G, he’s posted 52 PP/G over the past 14 days, the highest on the team.
Philadelphia Phillies
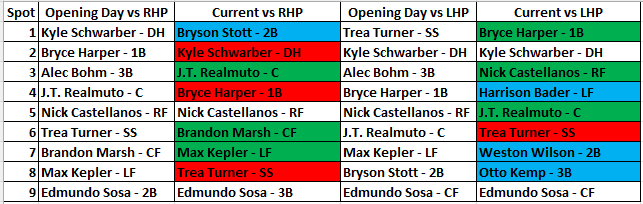
vs. RHP
Alec Bohm is the only player removed due to injury.
Bryson Stott has moved into the leadoff spot. He ranks 3rd in productive PAs ending in more than 4 pitches and 2nd in pitches seen per PA.
vs. LHP
Alec Bohm, Max Kepler, and Bryson Stott have been removed.
Harrison Bader, acquired via trade, now bats cleanup. He ranks 3rd in productive PAs with RISP and 4th in runs generated.
One notable case: Trea Turner. Despite hitting near the top of the Phillies’ actual lineup, he ranks near the bottom in the optimizer. He’s averaging just 4 PP/G vs. RHP (8th on team) and 3 PP/G vs. LHP (5th), and does not rank strongly in either the on-base or power components.