
Optimizing 2025 MLB Lineups with the Plane Points Scoring System (Dodgers & Cubs)
A fully updated data-driven approach to constructing the best possible lineups...

I introduced a process to optimize MLB lineups a few months ago using my custom scoring system, Plane Points. Since then, I’ve completely revamped it to create the most effective lineups possible for every team. If you’re curious about the original version (1.0), check out my previous article here. Today, I’m unveiling Version 2.0—a smarter, more precise tool. Let’s dive into what’s changed and how it works.
What’s New in Version 2.0?
The leap from Version 1.0 to 2.0 hinges on two pivotal upgrades. First, I’ve devised a formula that smooths Plane Points per Game (PP/G) by weaving plate appearances into a mix with carefully calibrated constants. This tames the distortion of small sample sizes, letting a player’s PP/G reflect their true talent—not just their trips to the plate. That same blended approach now sharpens every attribute across the optimizer’s components. Second, Version 2.0 splits performance against left-handed (LHP) and right-handed pitchers (RHP) into distinct, nuanced profiles, scrapping the vague, one-size-fits-all metrics of Version 1.0. The core process holds steady—players score points per attribute based on their team rank—but these refinements dial up the precision. Here’s how the revamped attributes fuel it:
General & Matchup-Specific Attributes
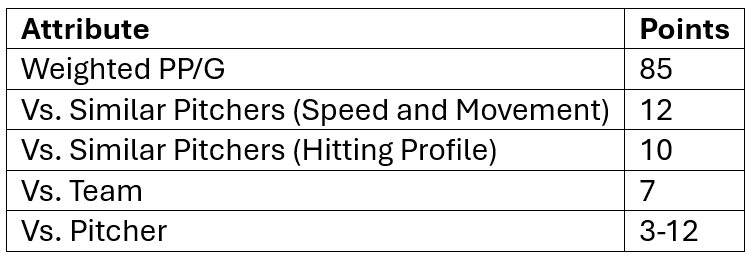
Version 2.0 unveils an enhanced PP/G calculation that merges plate appearances with performance metrics, yielding a more dependable and revealing statistic. You might be curious about my decision to assign 85 as the weighted point value for this attribute. For matchup-specific lineups, I aimed for a proportion that I felt made the most sense—approximately a 70/30 split—between points drawn from overall performance and those explicitly linked to the matchup. Dividing 85 by the sum of all weighted point values delivers roughly 70%, a purposeful choice to ensure matchup-specific points serve as a valuable enhancement rather than overshadowing the core “Weighted PP/G” calculation (with slight variations depending on the weight given to the “Vs. Pitcher” attribute).
To enhance these matchup-specific lineups even further, I’ve woven in Baseball Savant’s similarity scores, which enrich pitcher comparisons by factoring in hitting outcomes—think walks, strikeouts, and barrels—alongside the existing speed-and-movement parallels. This creates a more vivid and nuanced picture of how a batter might fare against a specific pitcher. You’ll notice the “Vs. Pitcher” attribute carries a weight ranging from as low as 3 to as high as 12. This range reflects a deliberate decision: batters with more exposure to a pitcher see their performance weighted more heavily, while those with less familiarity receive a lighter touch. Ultimately, the “Vs. Pitcher” attribute offers the clearest window into player performance in these tailored, matchup-driven scenarios.
Weighted PP/G forms the foundation for general lineups against each pitcher handedness, providing a sturdy baseline. The final three attributes then step in, fine-tuning the adjustments to deliver matchup-specific precision.
On-Base Ability
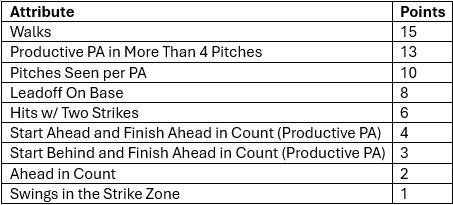
This component, which crowns the leadoff hitter, now blends data from the current season and the past three years into each attribute’s weighted calculation. I’ve swapped out two Version 1.0 attributes (Start Behind/Finish Even and Start Ahead in Count) for four new ones: Pitches Seen per PA, Leadoff On Base, Hits w/ Two Strikes, and Swings in the Strike Zone. These additions better capture a hitter’s discipline and effectiveness. For matchup-specific lineups, these metrics get layered in too.
Power/Clutch
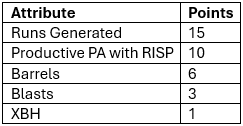
Used to slot the 4th and 5th spots, this component also merges current and three-year performance. I’ve streamlined doubles, triples, and home runs into a single Extra-Base Hits (XBH) attribute and added Statcast’s barrels and blasts to spotlight elite power. Like the on-base metrics, matchup-specific attributes enhance this section when needed.
Building the Lineups
If you read my first article, you’ll recall the step-by-step lineup construction process. With the Cubs and Dodgers set to open the 2025 MLB season soon, I’ve applied Version 2.0 to craft their optimal lineups. Time’s tight, so I won’t walk through every detail here—check out this post for the full breakdown. That said, a few key updates are worth noting:
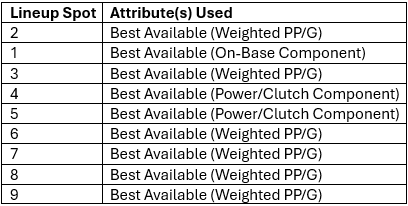
Order Shift: The leadoff spot now gets filled before the 3rd spot, prioritizing the two highest plate-appearance slots with the best fits.
Players are assigned to positions based on their most frequent spring training starts (e.g., Tommy Edman’s 12 starts at 2B vs. 2 in CF slots him at 2B, unless that spot is already filled). Once the regular season begins, position assignments are updated based on regular-season appearances at each position.
Prospect Integration: Version 2.0 now accounts for players without MLB experience by using MiLB stats from the past three years (via Baseball Savant). To adjust for the minors-to-majors leap, I scale their performance to 80%. For example, Matt Shaw’s 18.49 PP/G in AAA last year becomes 14.79 PP/G in my model. Players without plate appearances in the last three years are excluded to keep the data fresh.
For the Cubs and Dodgers, I’ve generated two lineups each: a general one against RHPs or LHPs, and a matchup-specific one for their Game 1 starters—RHP Yoshinobu Yamamoto for the Dodgers, LHP Shota Imanaga for the Cubs. Let’s see the results.
Dodgers
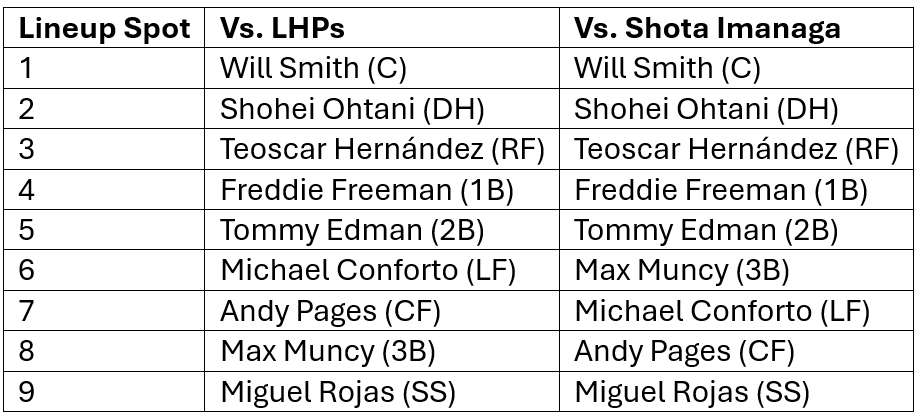
After running the optimizer, the Dodgers’ general lineup against LHPs adjusts slightly for Shota Imanaga. LF Michael Conforto slides down while 3B Max Muncy climbs, powered by Muncy’s 13.95 PP/G against the Cubs (compared to Conforto’s 2.36 PP/G) and his three plate appearances against Imanaga (Conforto’s yet to face him). Mookie Betts’ absence at SS for this opening series shakes things up—he’d have claimed the leadoff spot, shoving Will Smith down the order. Even so, the optimizer slots Smith as a prime table-setter.
Cubs
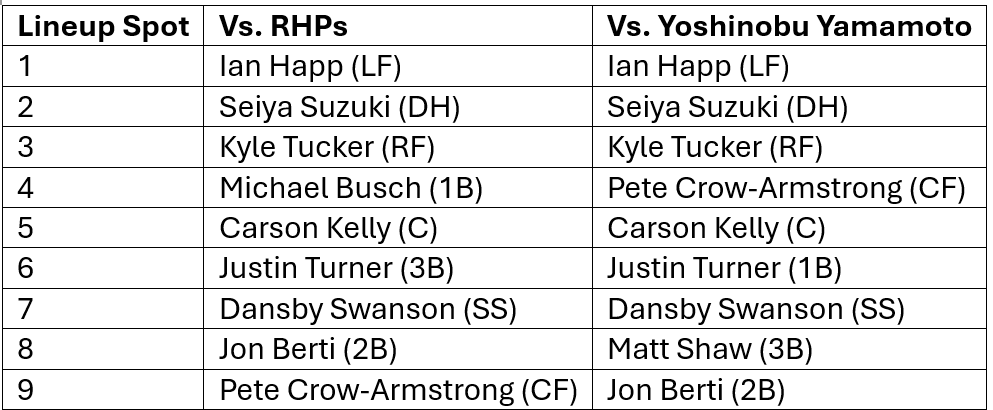
The Cubs see more dramatic shifts. CF Pete Crow-Armstrong vaults up the matchup-specific lineup thanks to his success against the Dodgers and Yamamoto (small sample noted). This bumps 1B Michael Busch, who’s struggled against Yamamoto, out of the mix. Meanwhile, 3B Matt Shaw cracks the lineup, leveraging his spring training reps at third—Busch grades higher but hasn’t logged time there this spring.
Looking Ahead
With the other 28 teams taking the field later this month, I’ll be posting their optimized lineups on my X page as soon as rosters and Opening Day starters are set. Follow me there for the latest drops. But Opening Day is just the starting line—this optimizer’s real power lies ahead. As the 2025 season unfolds and fresh data rolls in, I’ll keep fine-tuning these lineups to unlock their full potential, especially when new faces emerge via trades, promotions, or waiver claims. I might even shadow one team night after night, churning out matchup-specific lineups for every game. Sharper, more flexible, and primed for action, this revamped tool is ready to dominate the diamond in 2025.
interesting stuff