
Plane Points: MLB Lineup Optimizer (Results & Analysis)
Evaluating the impact of data-driven lineup optimization over a complete MLB season

Introduction
If you’ve been following my blog or X page, you know that I introduced an extension of Plane Points, my player evaluation tool, in the form of a comprehensive MLB Lineup Optimizer.
In earlier posts, I discussed the process behind designing the optimizer and the logic that powers it. This post focuses on evaluating the lineup optimizer's effectiveness and identifying key areas for improvement moving forward.
For time’s sake, I wasn’t able to optimize every team’s lineup for every game of the season. However, I did generate optimized lineups for the Miami Marlins and their opponents across all 162 regular-season games, as well as for every postseason matchup.
Each optimized lineup was built with the opposing team and pitcher in mind, providing a large enough sample to evaluate how well the optimizer performed overall.
While every team the Marlins faced is represented in the dataset, the number of optimized lineups varies by opponent. For example, the Twins only appear three times since they played the Marlins just three times during the regular season. In contrast, divisional rivals like the Phillies and Mets appear far more frequently.
Because of this variation, results should be interpreted with sample size in mind. Larger samples, such as the Marlins and their frequent opponents, are the most reliable indicators of the optimizer’s effectiveness, while smaller ones serve more as snapshots.
Methodology and Weighting System
To measure effectiveness, I compared my optimized lineups to the actual lineups used by teams in each game.
To add more nuance, I implemented a weighted scoring system that accounts for the impact of lineup position. Since players higher in the order typically receive more plate appearances and have greater influence on outcomes, their Plane Points were assigned greater value.
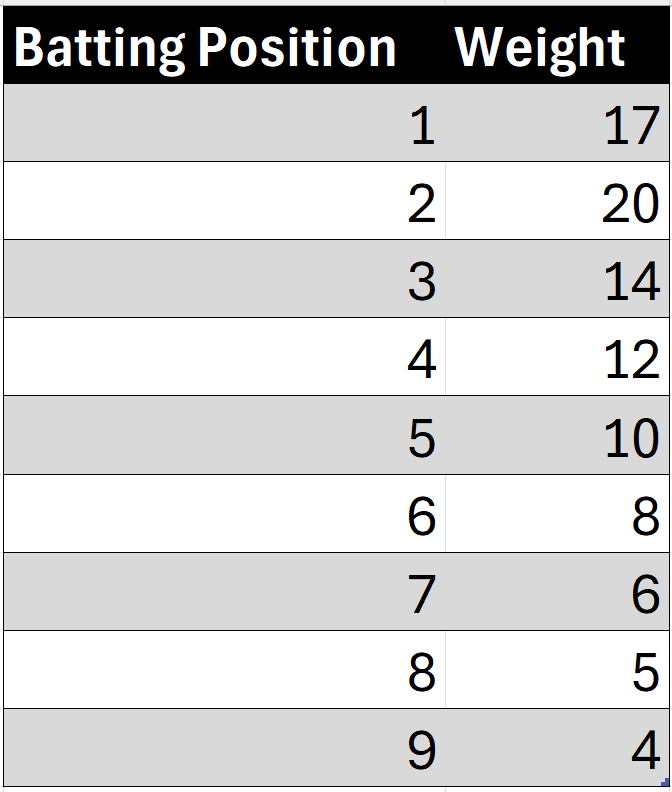
Using these weights, each player’s Plane Points were multiplied by their lineup slot value, and the results were summed to produce an overall weighted Plane Points score for the lineup. I then compared this score to that of the team’s actual lineup using the same method.
For example, consider the Marlins’ game on March 27. My optimized lineup is shown on the left, and the actual lineup used that day is on the right.
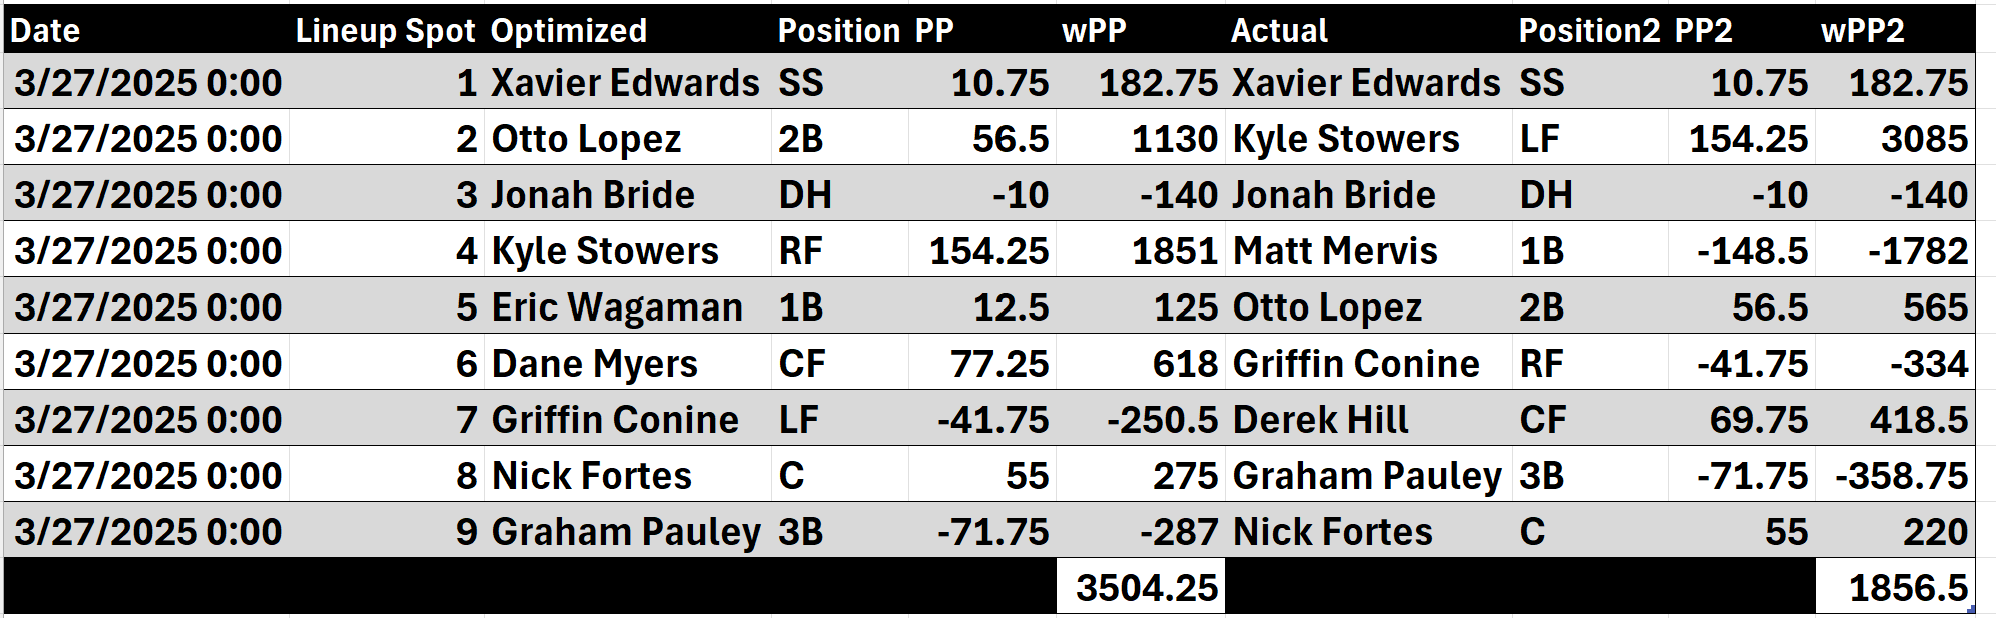
There were key differences, such as my inclusion of Eric Wagaman and Dane Myers, who were not in the actual starting lineup.
You might wonder how certain players accumulated Plane Points despite not starting the game. In Myers’ case, he entered the game later, so his production reflects only the performance from that point forward. For Wagaman, who did not appear at all, his contribution was estimated using his average per-game performance leading up to that contest. Since this was Opening Day, those values were based on his 2024 season averages. There were several instances where proxy values had to be used for players who didn’t appear in the game, even though the lineup optimizer projected they should have been included.
After running the calculations, my optimized lineup outperformed the actual lineup, primarily due to the first-base decision. The optimizer preferred Wagaman over Matt Mervis, who struggled in that game.
Defining Success
Before jumping into the results, it is worth clarifying what “success” means in this context.
The goal wasn’t to create a perfect lineup every time, but rather to see how often the optimizer produced a higher weighted Plane Points score than the actual lineups.
In other words, this project measured decision efficiency. Could a data-driven model consistently make better day-to-day lineup choices than MLB managers, given the same roster and context?
Of course, real-world lineup decisions also consider factors my model doesn’t yet capture, such as platoon advantages, player rest schedules, injuries, and clubhouse dynamics.
Still, by isolating the performance side of the equation, this analysis offers a clear, data-driven look at where the optimizer adds value and where it can continue to evolve.
Results Overview
Across all matchups evaluated, my lineup optimizer outperformed the actual MLB lineups 54.1% of the time (226 of 418 total lineups). While that success rate may not sound overwhelming at first glance, it’s important contextually: the optimizer had no access to inside information like player fatigue, injury management, or bullpen availability. Within those constraints, outperforming human decision-making more than half the time demonstrates that a data-driven lineup approach can hold its own against professional-level judgment.
In the summary table below, you’ll find each team, the number of lineups/games evaluated, and whether my optimized lineups “exceeded” the actual lineups. The “Exceed %” represents the share of games in which the optimizer outscored the real lineup.
Two additional metrics are included:
Total Weighted Difference: The cumulative weighted Plane Points difference between my lineups and actual ones.
Average Weighted Difference: The total weighted difference divided by the number of games tracked.
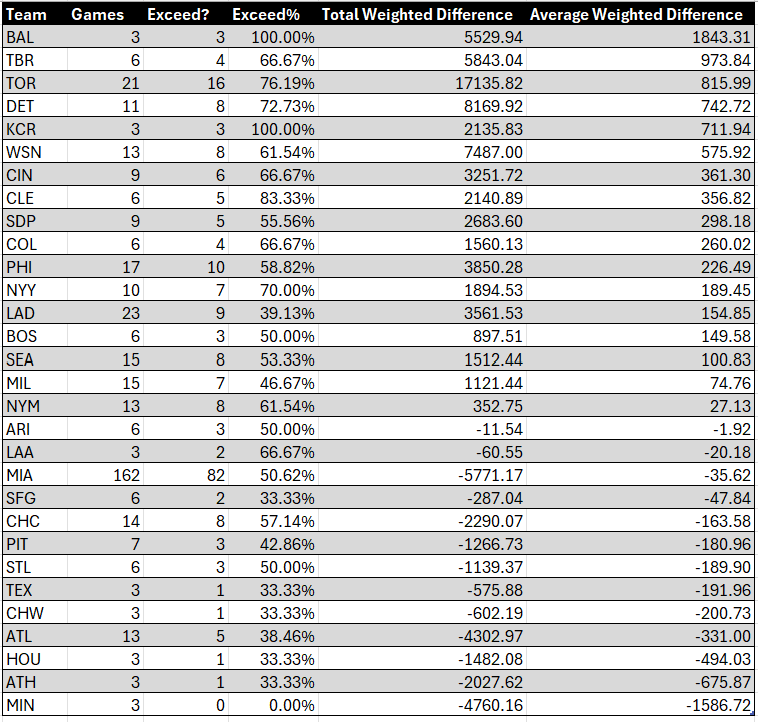
For example, the optimizer achieved a 100% success rate for both the Orioles and Royals. However, each team had only three games analyzed, which represents a relatively small sample size. When looking at teams with a larger sample, the optimizer performed especially well on the Blue Jays, a team I was able to evaluate throughout both the regular season and the playoffs. Among teams with lineups generated in at least 10 games, the Blue Jays had the highest success rate.
Focus on the Miami Marlins
Since the Marlins were the focal team of this project, let’s examine their results in more detail.
Out of 162 optimized lineups, the optimizer outperformed the Marlins’ actual lineup in 82 games (50.62%), ranking 17th among all MLB teams.
The average weighted difference for the Marlins was -35.62 (20th overall), meaning the Marlins’ manager’s lineups slightly outperformed mine on average.
Let’s take a closer look at the composition of my lineups compared to the Marlins’ actual lineups, with a focus on handedness. The table below highlights the most frequently selected player at each lineup position based on handedness, and compares those selections to the players the Marlins actually used.
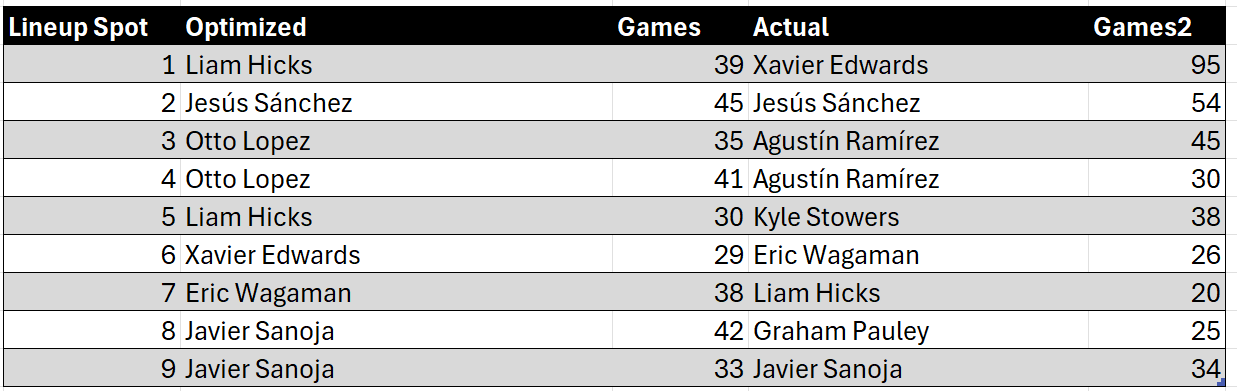
Against right-handed pitchers, one of the biggest differences came in the leadoff spot. My optimizer frequently selected Liam Hicks, while the Marlins typically went with Xavier Edwards.
This makes sense because my optimizer evaluates offensive output but does not consider speed or baserunning value, areas where Edwards excels. That limitation likely influenced the discrepancy.
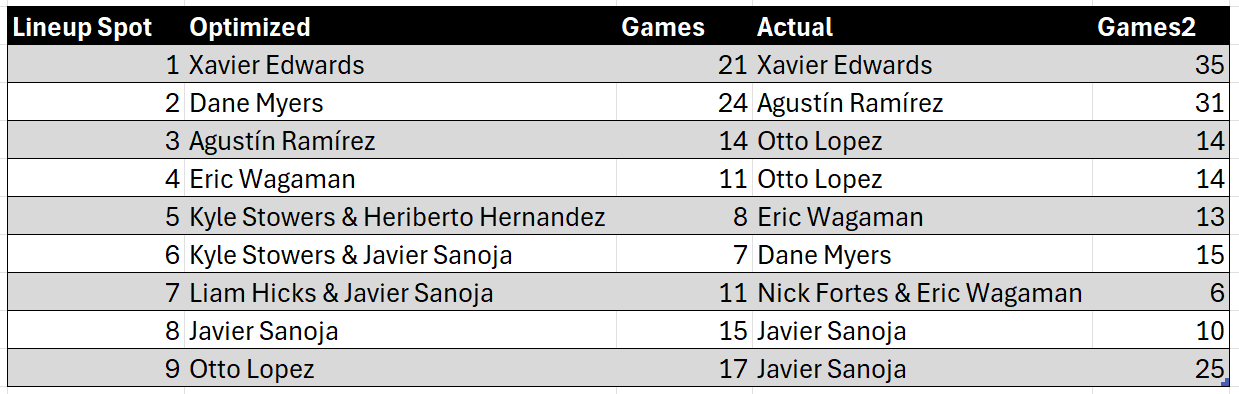
Against left-handed pitchers, the optimizer was more in sync with the Marlins’ real lineups. However, it often preferred Dane Myers in the two spot, while the Marlins went with Agustín Ramírez more frequently. Interestingly, the optimizer still valued Ramírez; it simply slotted him into the third position more often.
High and Low Points
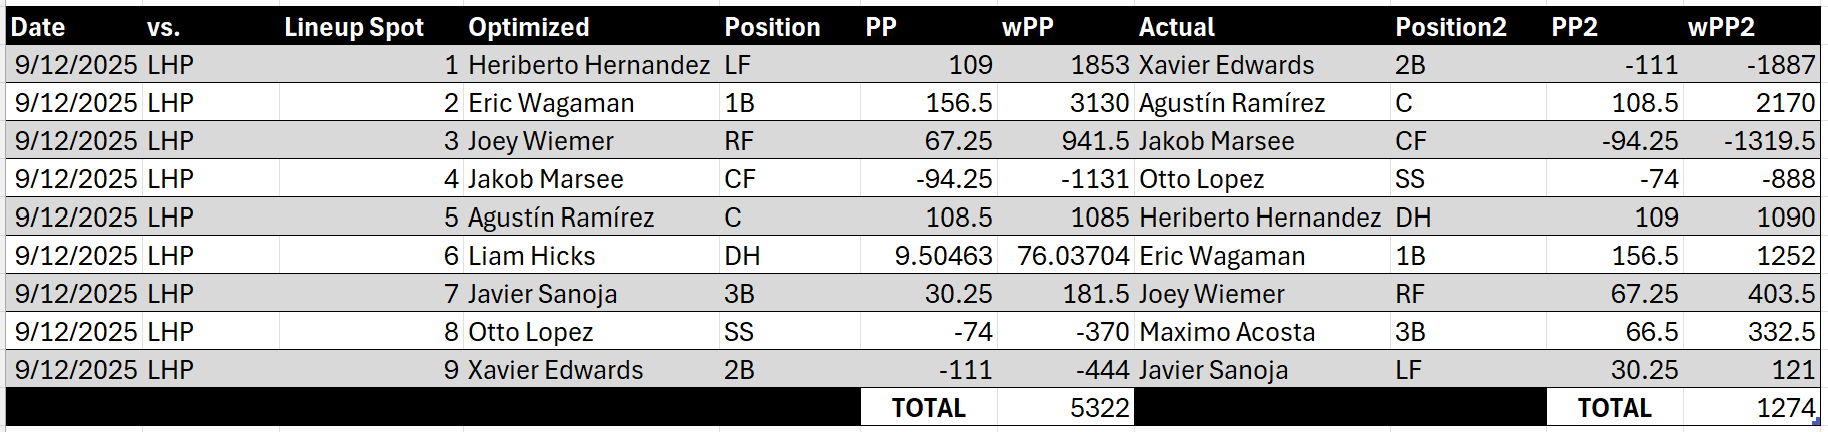
September 12 vs. Tigers (LHP Tarik Skubal)
My lineup outscored the actual Marlins lineup by 4,048 weighted Plane Points, the largest margin of any Marlins game.
The difference stemmed from my optimizer moving Hernandez, Wagaman, and Wiemer to the top three spots, while the actual lineup pushed them down the order. Additionally, Xavier Edwards, who struggled that day, was used as the leadoff hitter in reality but was placed ninth in my lineup.
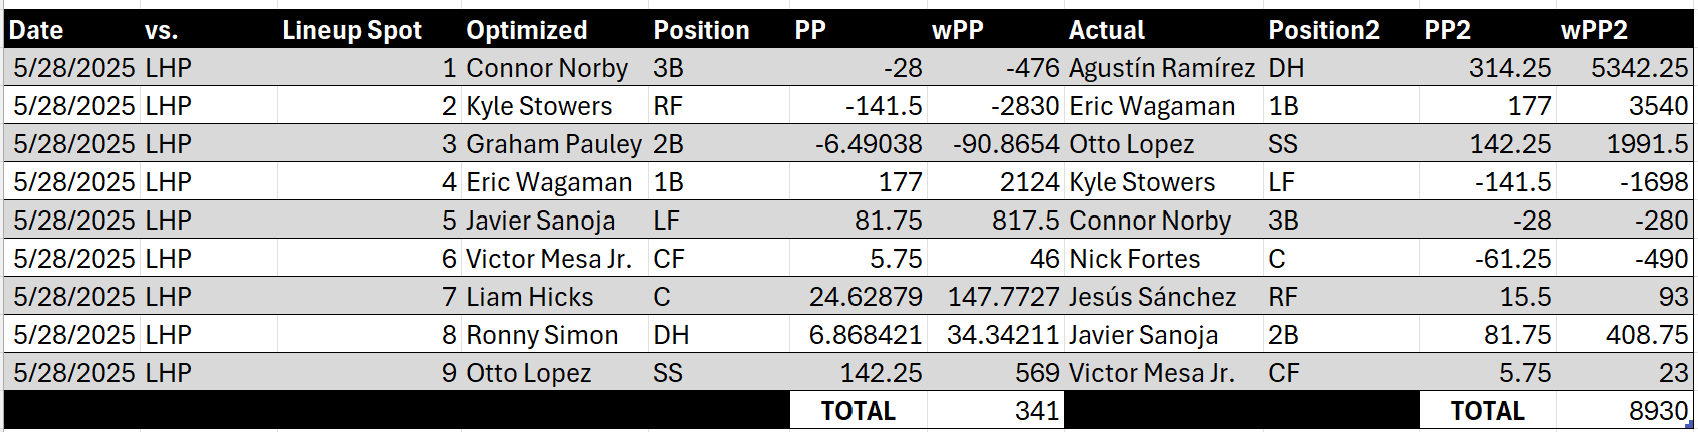
May 28 vs. Padres (LHP Kyle Hart)
This was the optimizer’s worst performance for the Marlins. The actual lineup outscored mine by 8,589 weighted Plane Points, mainly because Agustín Ramírez was excluded from my optimized lineup while he went on to have a huge game.
League-Wide Standouts
Across all teams, the optimizer produced some clear highs and lows.
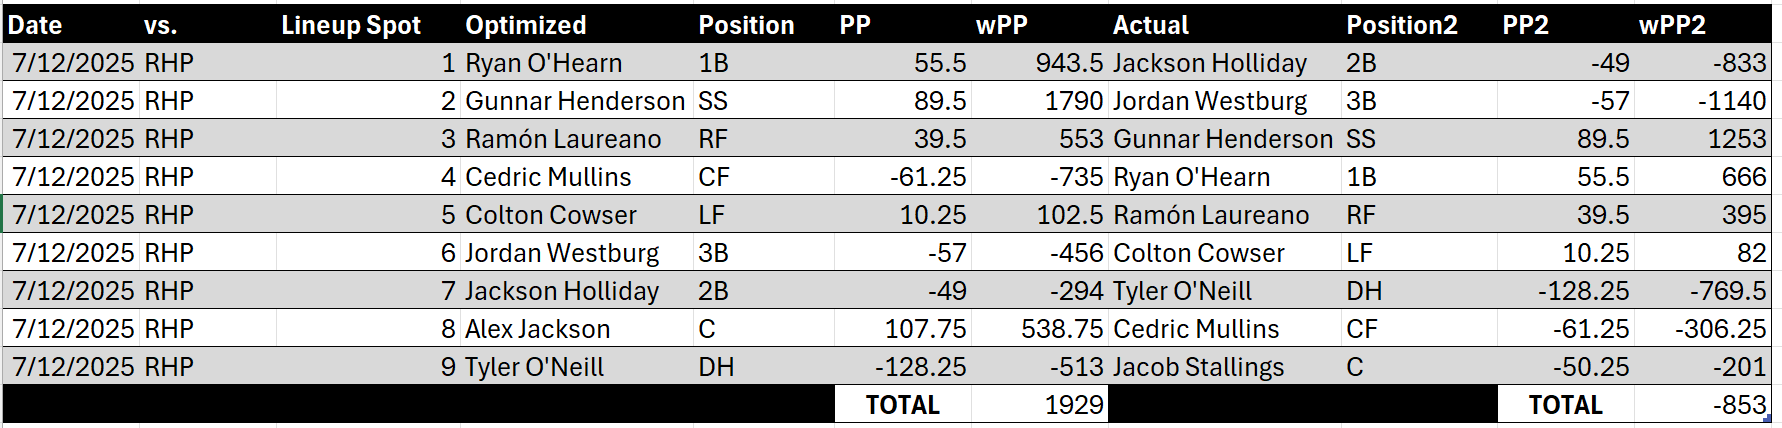
Best Performance: Baltimore Orioles
The optimizer achieved a 100% success rate in three games for the Orioles. The standout came on July 12 against RHP Janson Junk and the Marlins.
Key differences that boosted my lineup included moving Westburg and Holliday further down the order, which paid off given their poor performances, and selecting Alex Jackson as the starting catcher instead of Jacob Stallings, a decision that swung the results significantly in my direction.
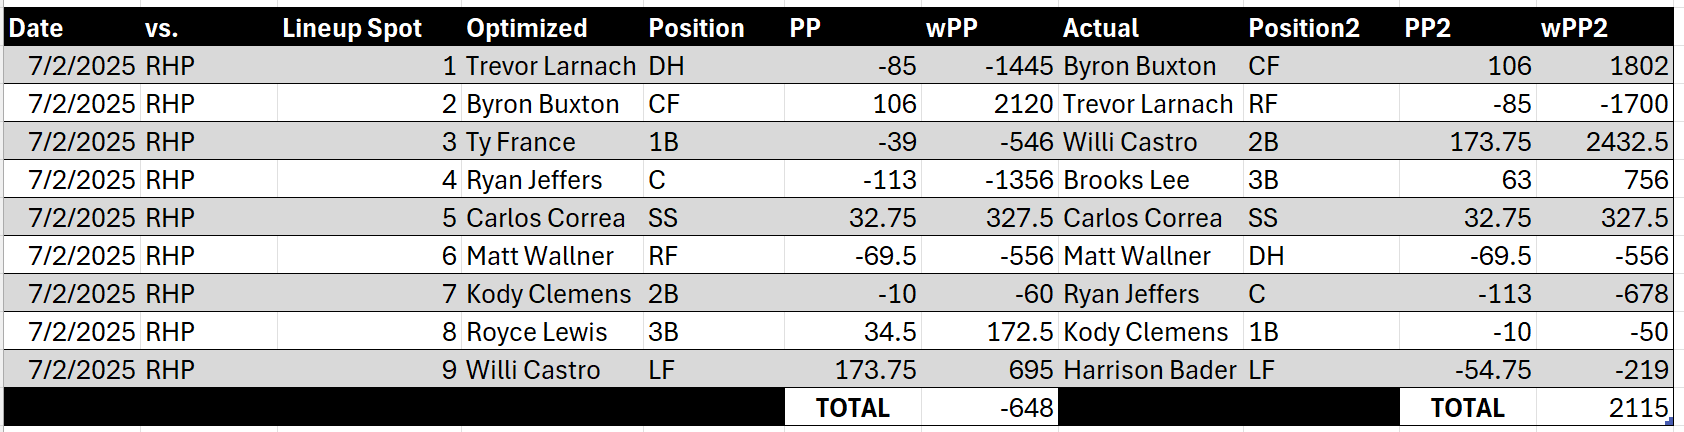
Worst Performance: Minnesota Twins
Conversely, I failed to outperform the Twins in any of their three games.
The weakest result came on July 2 against RHP Janson Junk and the Marlins, where lineup construction hurt my score. I placed Willi Castro in the ninth spot while he excelled, hitting third, and I omitted Brooks Lee, who had a strong outing.
The result was the smallest average weighted difference of any team.
Takeaways and Next Steps
After year one of testing the Lineup Optimizer, there is more good than bad. The model outperformed actual MLB lineups for 17 of 30 teams, a promising start that still leaves room for improvement.
What Worked
The optimizer captured creative lineup combinations that MLB managers might not typically use. The Plane Points framework also proved effective in identifying underutilized contributors.
Areas for Improvement
Incorporate non-offensive factors such as defense, baserunning, and speed, which play a significant role in real-world lineup decisions but were not fully accounted for in the optimizer.
Adjust for sample size to reduce the impact of small-sample outliers. Larger samples should carry more weight to ensure lineup decisions are grounded in sustainable performance.
Reevaluate short-term form metrics, such as performance over the last 7 or 14 days, to better capture hot or cold streaks and reflect recent trends more accurately.
Refine lefty-righty constraints, as overly strict avoidance of consecutive left-handed hitters sometimes led to weaker bats being forced into the lineup, reducing overall offensive potential.
Balance current vs. previous season performance more dynamically. Early-season standouts were occasionally undervalued due to heavy reliance on prior-year data, which may have masked legitimate breakout performances.
Closing Thoughts
This was a fascinating and rewarding exercise. Year one showed that a data-driven approach can compete with, and often exceed, the decisions made by MLB managers, but it also highlighted how complex lineup construction truly is.
Looking ahead, I plan to automate and refine the optimizer to scale across all 30 teams for every game. That will enable a deeper, league-wide evaluation and bring me closer to building a comprehensive, real-time lineup optimization system.