
Plane Points Leaders: A Deep Dive into Hitter Performance Across the League (2025 Regular Season)
An in-depth look at the standout performances from the 2025 regular season...


Just like that, the 2025 MLB regular season has come to an end. Even with so much still to look forward to in the playoffs, it is time to look back on the regular season that was through the lens of Plane Points (PP).
If you are new to my blog or need a refresher on what Plane Points is, you can check out this post.
In this article, I will break down everything Plane Points has to offer with a focus on hitters. Pitchers will come in the next piece. I will review the best and worst hitters of the season, highlight some of the top and bottom individual performances, and take a closer look at the leaders and trailers by category.
For a complete look at hitter performance, feel free to check out my R Shiny App that houses all the data: https://thestatman.shinyapps.io/PlanePoints4Hitters/.
*To qualify for any of these lists, a batter must be recording at least 2.1 PA per team game*
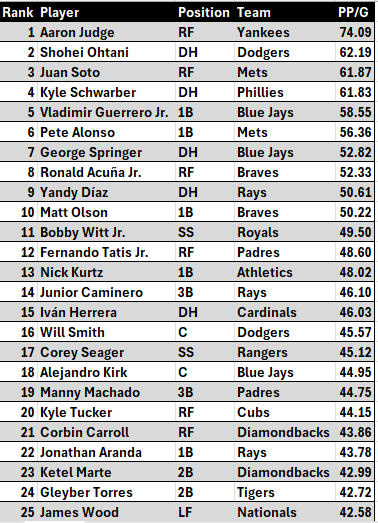
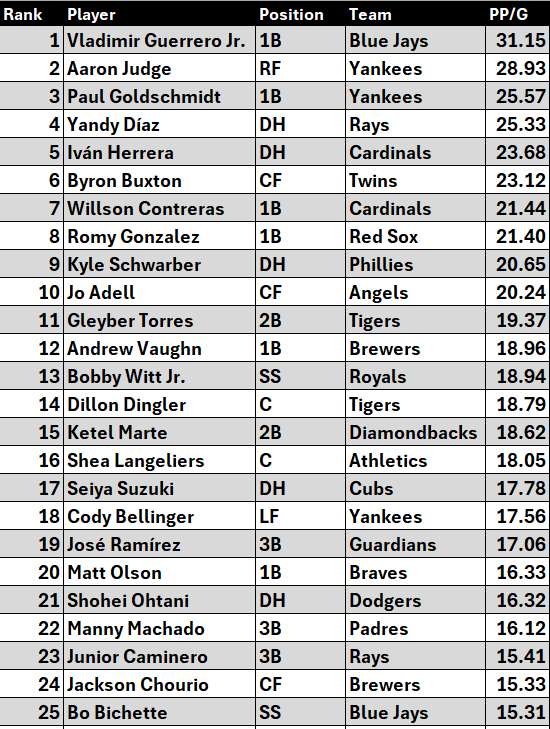
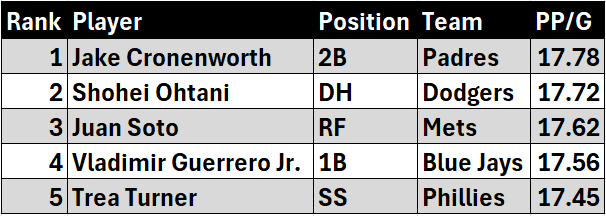
Top 25 Overall
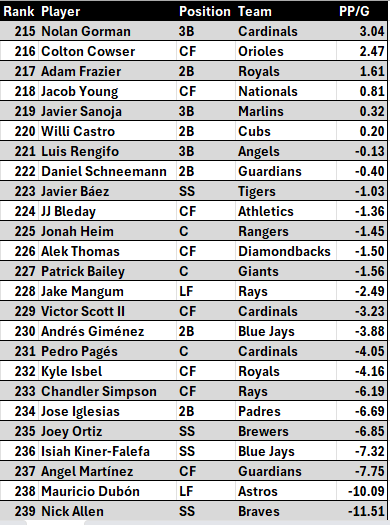
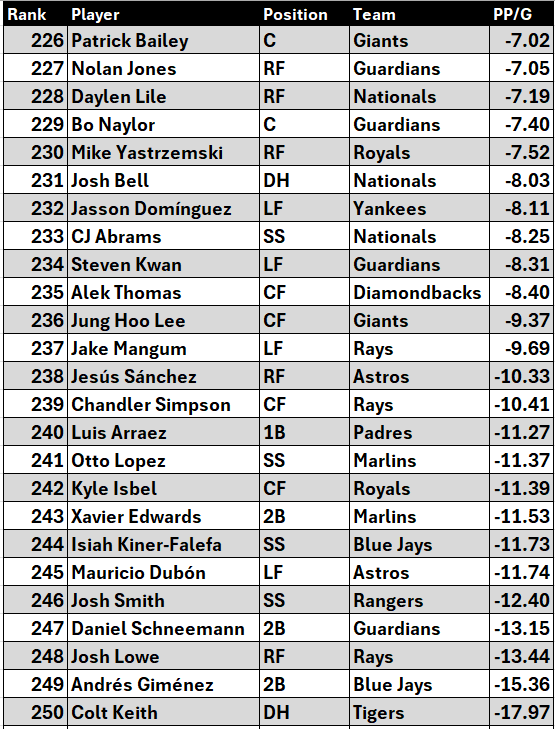
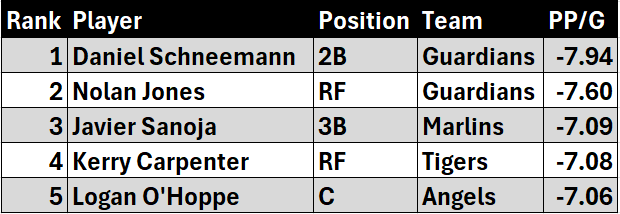
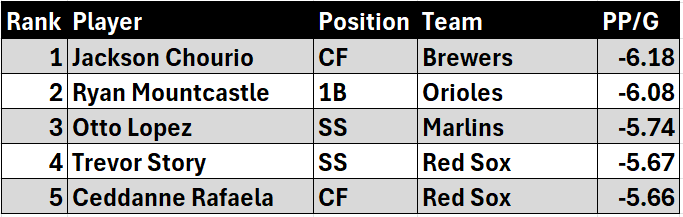
Bottom 25 Overall
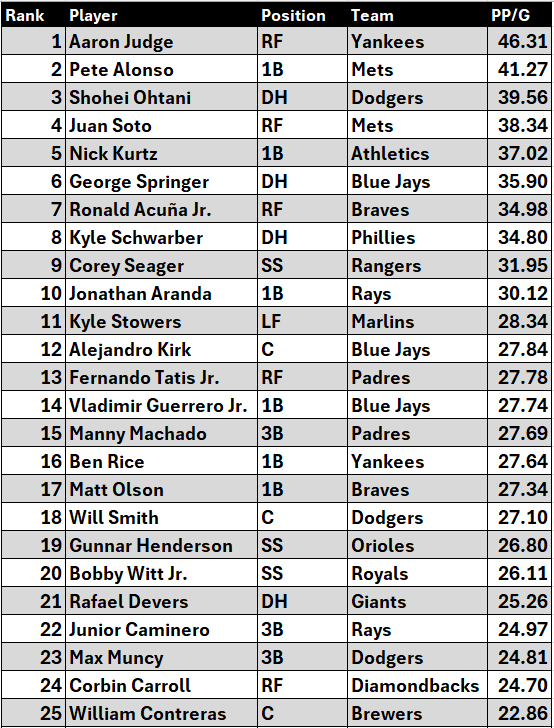
Top 25 vs. RHP
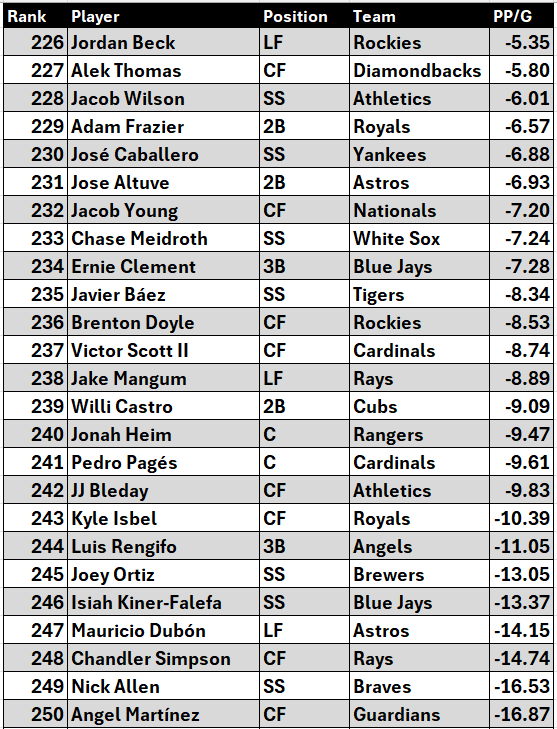
Bottom 25 vs. RHP
Top 25 vs. LHP
Bottom 25 vs. LHP
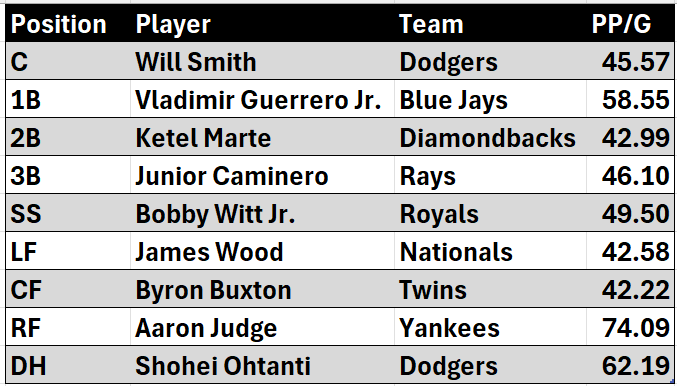
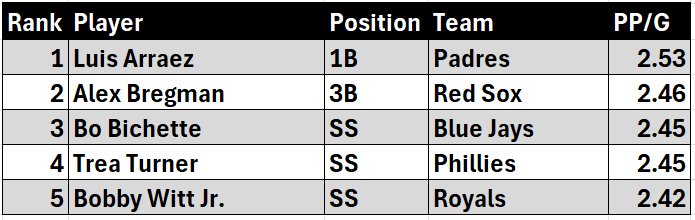
1st Team All-Plane
These lists focus on the top player at each position. Think All-Pro teams.
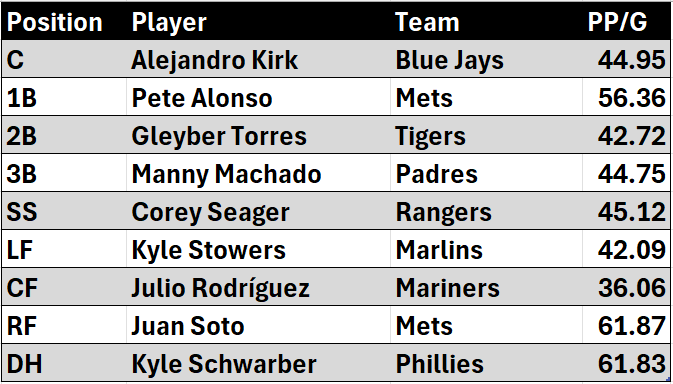
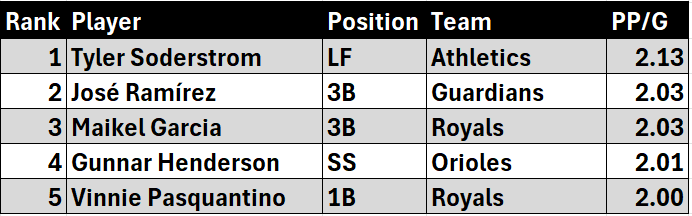
2nd Team All-Plane
Breakdown by Team
This table shows the percentage of qualifying players (QPs) on each team who were either above average (AA), in the top 25%, or in the bottom 25% (for players who appeared on multiple teams this year, this is based on the team they finished the year with). This season, the average Plane Points per Game (PP/G) was 21.46. Any player whose PP/G was above that was considered an above-average player. To qualify for the top 25%, a player must have earned at least 29.92 PP/G. To qualify for the bottom 25%, a player must have earned 11.27 PP/G or fewer. The table is sorted in descending order based on the percentage of above-average players.
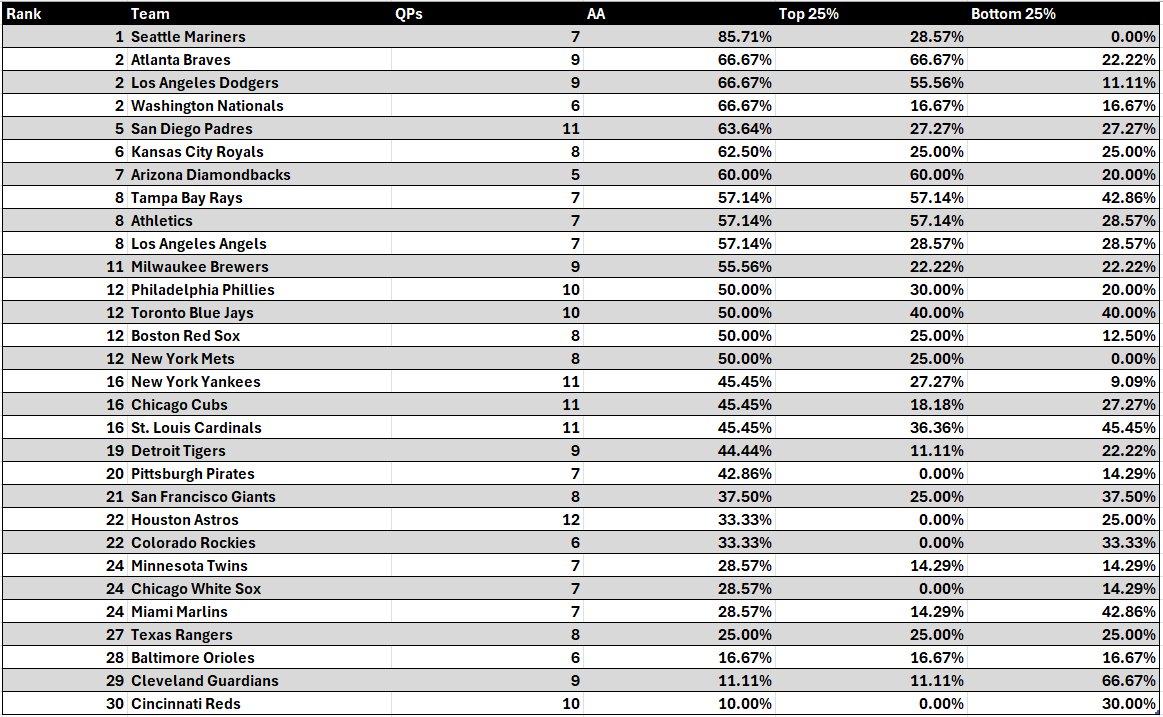
The Seattle Mariners led all of MLB in the percentage of above-average players. This includes Josh Naylor, Cal Raleigh, Julio Rodríguez, Jorge Polanco, Randy Arozarena, and J.P. Crawford. Both Cal Raleigh and Julio Rodríguez graded out in the top 25% of all qualifying players. No Mariners player was in the bottom 25%.
The Cincinnati Reds had the smallest percentage of above-average players. Only Elly De La Cruz. The Reds had no players in the top 25% and three players in the bottom 25% (Spencer Steer, Matt McLain, and Ke’Bryan Hayes).
Best Single-Game Performances
Nick Kurtz (ATH): 511.50 PP
July 25th vs. Astros
6-6, 1 2B, 4 HR, 8 RBI, 6 R, 19 TB
Aaron Judge (NYY): 444.75 PP
March 29th vs. Brewers
4-6, 1 2B, 3 HR, 8 RBI, 4 R, 14 TB
Kyle Stowers (MIA): 443.50 PP
July 13th vs. Orioles
5-5, 3 HR, 6 RBI, 4 R, 14 TB
Kyle Schwarber (PHI): 423.75 PP
August 28th vs. Braves
4-6, 4 HR, 9 RBI, 4 R, 16 TB
Kody Clemens (MIN): 406.25 PP
September 12th vs. Diamondbacks
4-4, 1 2B, 3 HR, 5 RBI, 3 R, 14 TB
Worst Single-Game Performances
Brooks Baldwin (CHW): -221.00 PP
September 4th vs. Twins
0-5, 2 K, 2 RLISP (Runners left in scoring position)Austin Hays (CIN): -217.00 PP
July 11th vs. Rockies
0-5, 4 K, GIDP, 5 RLISPColt Keith (DET): -213.50 PP
March 27th vs. Dodgers
0-5, 1 K, 2 RLISPJackson Chourio (MIL): -211.50 PP
April 23rd vs. Giants
0-5, 3 K, 3 RLISPBrandon Nimmo (NYM): -207.00
September 20th vs. Nationals
0-5, 1 R, 1 K, 2 RLISP
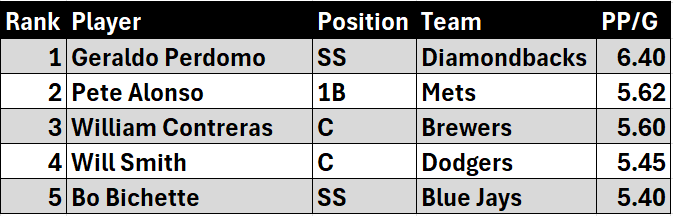
Leaders by Category
This section covers some of the main categories that make up the Plane Points scoring system. PP/G in this context refers to the number of points each player earns per game in a specific category.
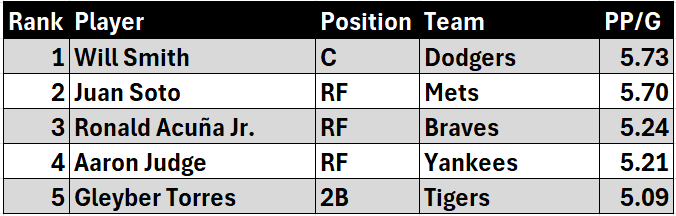
Productive Games (if a player gets on base or drives in a run in during at least one of their plate appearances in a game, they will earn 20 Plane Points)
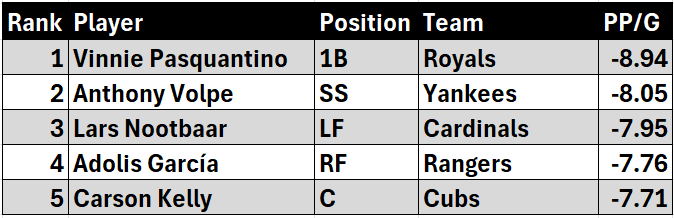
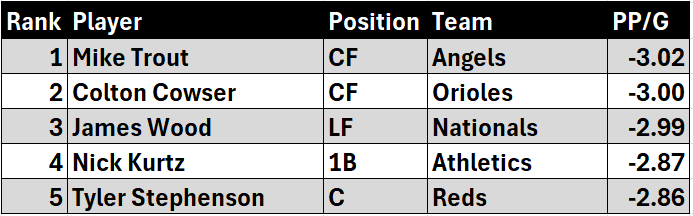
Unproductive Games (if a player fails to get on base or drive in a run during at least one of their plate appearances in a game, they will lose 20 Plane Points)
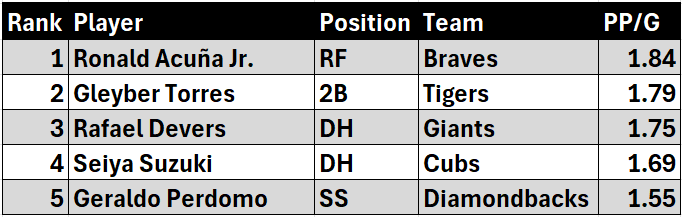
Productive PA w/ RISP (each time a player gets on base or drives in a run with runners in scoring position, they earn 10 Plane Points)
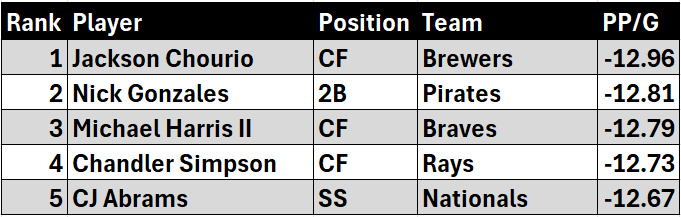
Unproductive PA w/ RISP (each time a player fails to get on base or drive in a run with runners in scoring position, they lose 10 Plane Points)
Productive PA of At Least 5 Pitches (each time a player gets on base or drives in a run after seeing at least 5 pitches, they earn 6 Plane Points)
Unproductive PA of 4 Pitches or Fewer (each time a player fails to get on base or drive in a run after seeing 4 pitches or fewer, they lose 6 Plane Points)
Productive PA…Start Behind/Finish Ahead in Count (each time a player starts behind/finishes ahead in the count and gets on base/drives in a run, they earn 5 Plane Points)
Unproductive PA…Start Behind/Finish Behind in Count (each time a player starts behind/finishes behind in count and fails to get on base/drive in a run, they lose 5 Plane Points)
Hits w/ Two Outs (each time a player gets a hit with two outs, they earn 5 Plane Points)
Hits w/ Two Strikes (each time a player gets a hit with two strikes, they earn 5 Plane Points)
Go Ahead Hit…5th Inning or Later (each time a player gets a hit in the 5th inning or later that puts their team ahead, they earn 25 Plane Points)
Multi-Strikeout Games (each time a player strikes out at least two times in a game, they lose 7 Plane Points)
Amazing this must take you a long time to do such great information for people